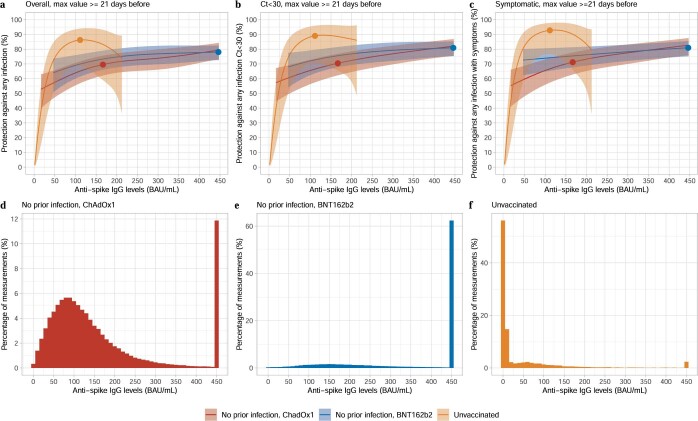
Extended Data Fig. 6. Association between anti-spike IgG levels and protection from SARS-CoV-2 infection using the maximum antibody measurement obtained ≥21 days prior to the visit.
a, protection against any infection; b, protection against infection with a moderate to high viral load (Ct value <30); c, protection against infection with self-reported symptoms. The 95% CIs are calculated by prediction ± 1.96 × standard error of the prediction. Three groups are investigated, unvaccinated participants with or without evidence of prior infection, participants vaccinated with ChAdOx1 without evidence of prior infection, and participants vaccinated with BNT162b2 without evidence of prior infection. Dots represent the median predicted individual peak levels from the Bayesian linear mixed models: 1026 BAU/mL for BNT162b2 (plotted at the upper quantification limit of 450 BAU/mL), 167 BAU/mL for ChAdOx1, and 111 BAU/mL for unvaccinated participants1. Distribution of the maximum anti-spike IgG measurements for the three population groups are shown in panel d, e, f. See Supplementary Fig. 4 and Supplementary Table 5 for timing of visits relative to second vaccination.

