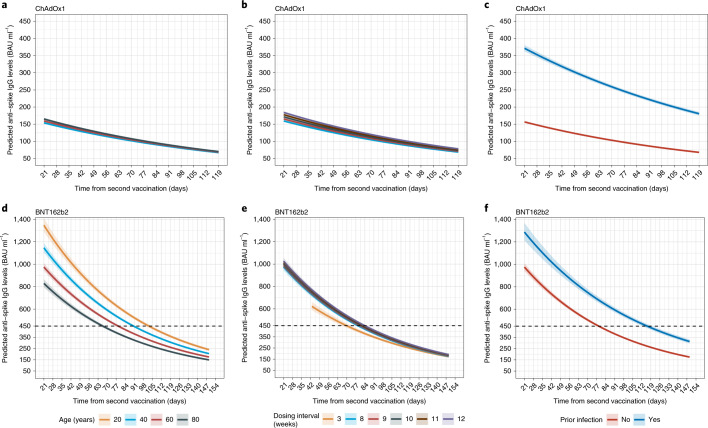
Fig. 2. Posterior predicted mean trajectories (95% CrI) of anti-spike IgG levels from 21 days after the second dose using Bayesian linear mixed interval censored models.
Models are adjusted for age, sex, ethnicity, long-term health conditions, healthcare role, deprivation, dosing interval and prior infection status. a,d, Trajectories by age. b,e, Trajectories by dosing interval. c,f, Trajectories by prior infection status. a–c, Participants who received two doses of ChAdOx1. d–f, Participants who received two doses of BNT162b2. Black dotted line shows the upper quantification limit of 450 BAU ml−1. For BNT162b2, as 52% of measurements were above the upper limit, the estimated peak levels were higher than 450 BAU ml−1 (interval censoring accounted for in analysis). Plotted at reference categories: 60 years, female, white ethnicity, not reporting a long-term health condition, not a healthcare worker, deprivation percentile of 60, 8-week dosing interval and no prior infection. In a, 20-year-old group is not plotted because the vast majority of those receiving ChAdOx1 were 40 years of age or older. These model estimates more completely adjust for confounders than the GAMs plotted in Extended Data Fig. 2 but estimate trends only after second vaccination.

