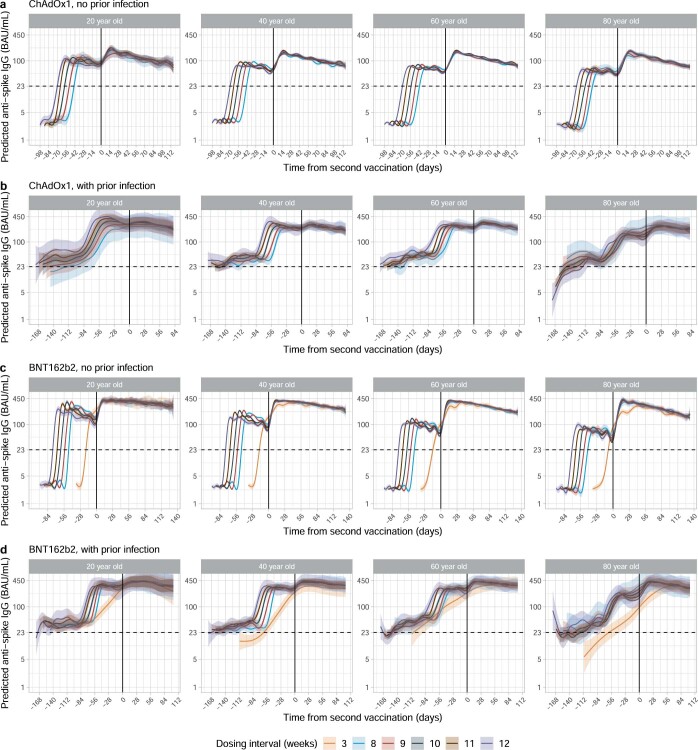
Extended Data Fig. 2. Mean anti-spike IgG levels by time from second vaccination in 20-, 40-, 60- and 80-year-olds according to dosing interval using generalised additive models adjusted for age and dosing interval.
a, Participants who received two doses of ChAdOx1 without prior infection. b, Participants who received two doses of ChAdOx1 with prior infection. c, Participants who received two doses of BNT162b2 without prior infection. d, Participants who received two doses of BNT162b2 with prior infection. Different x axis scales reflect different durations of follow-up post-vaccination in the different cohorts. Predicted levels are plotted on a log scale. Black dotted line indicates the threshold of IgG positivity (23 BAU/mL). Black solid line indicates the second vaccination date. Line colour indicates response predicted for 3 weeks, 8–12 weeks dosing interval. The 95% CIs are calculated by prediction ± 1.96 × standard error of the prediction.

