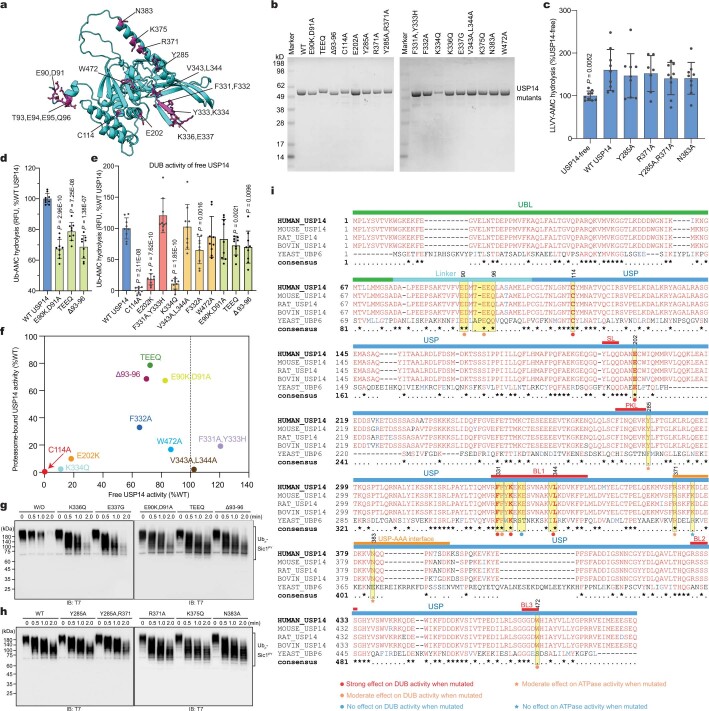
Extended Data Fig. 9. Structure-based site-directed mutagenesis.
a, Mapping of the potential RPT-binding sites and other residues affecting USP14 activation onto the USP14 structure in the model. The UBL domain of USP14 is not shown. b, Purification of USP14 mutants and analyzed by SDS/PAGE and stained with Coomassie blue. c, Peptidase activity assay was used to evaluate the effects of USP14 variants on regulating the CP gate opening. P values were analyzed using a two-tailed unpaired t-test between wild-type USP14-bound and USP14-free proteasomes. The results suggest that the mutants promote the CP gate opening to the same degree as that of wild-type USP14 as compared to that of the USP14-free proteasome. d and e, Ubiquitin-AMC hydrolysis assay to measure the DUB activity of USP14 mutants in the presence (panel d) or absence (panel e) of the human proteasome. Data are presented as mean ± s.d. from three independent experiments. P values were analyzed using a two-tailed unpaired t-test between USP14 mutants and wild-type USP14. P value is not labelled for data with P > 0.05, which is not significant. Data in c–e are presented as mean ± s.d. from three independent experiments, each with three replicates. Dots, individual data points. f, The DUB activity of USP14 mutants in the presence or absence of proteasome. Data points are the average of individual data points shown in panels (d) and (e) and Fig. 2i. g and h, In vitro degradation of Ubn-Sic1PY by the 26S proteasome in the presence of USP14 mutants testing the USP-OB interface or linker region (panel g) and affecting the USP-AAA interfaces (panel h) (repeated three times with similar results). Samples were analyzed by SDS–PAGE/Western blot using anti-T7 antibody. TEEQ, insertion of TEEQ after residue 92 in the linker region. Δ93–96, mutant with deletion of residues 93-96 in the linker region. W/O, the proteasome without binding to USP14. WT, the wildtype USP14-bound proteasome. i, Multiple sequence alignment of USP14 from five species was performed by Chimera. Annotation is based on the structural and mutational data from Figs. 2 and 3. The mutations with the strongest phenotypes (marked by red stars) all correspond to the amino acids (highlighted bold) that are fully conserved from yeast to human. Those mutations with moderate phenotypes correspond to the amino acids that are well conserved in mammals but may vary in yeast. For gel source data, see Supplementary Fig. 1

