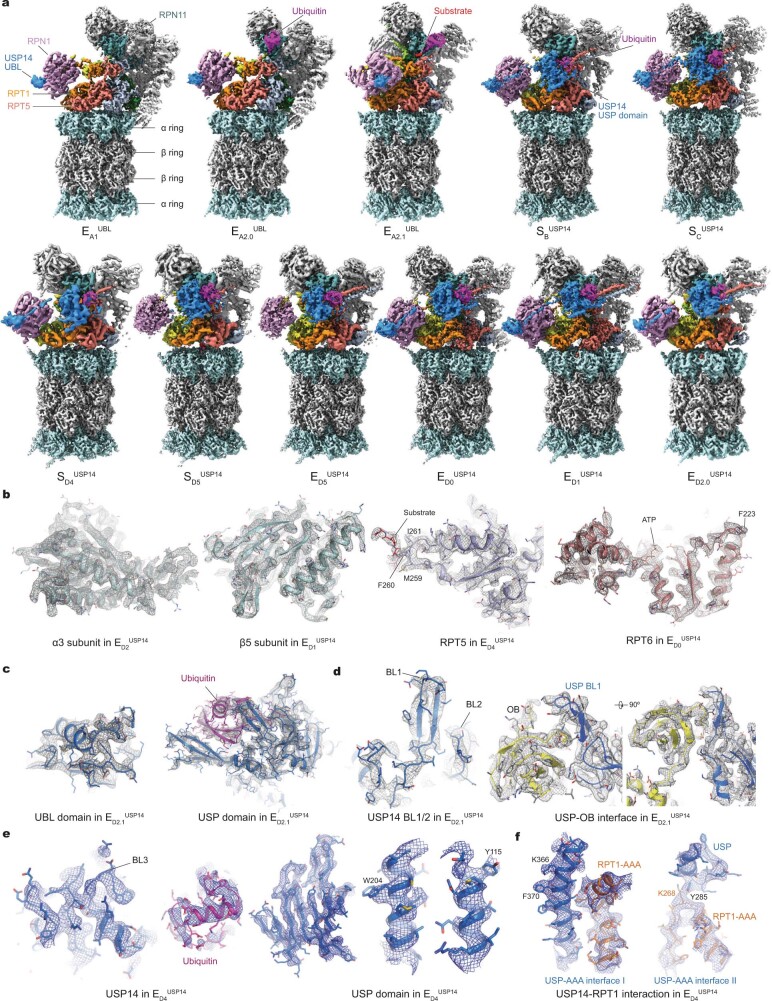
Extended Data Fig. 4. Cryo-EM maps and quality assessment.
a, Gallery of all refined cryo-EM maps not shown in the main figures. b–f, Typical high-resolution cryo-EM densities (mesh) of secondary structures superimposed with their atomic models. Different subunits of the proteasome are shown in (b), where the substrates shown in the middle panel are modelled using polypeptide chains without assignment of amino acid sequence. c, High-resolution cryo-EM densities of the two domains of USP14 in state . d, High-resolution cryo-EM densities of USP14 BL1 and BL2 loops and USP-OB interface in state . e, High-resolution cryo-EM densities of the BL3 loop, ubiquitin and representative secondary structure elements in the USP domain of USP14 in state . f, High-resolution cryo-EM densities of USP-AAA interfaces in state .

