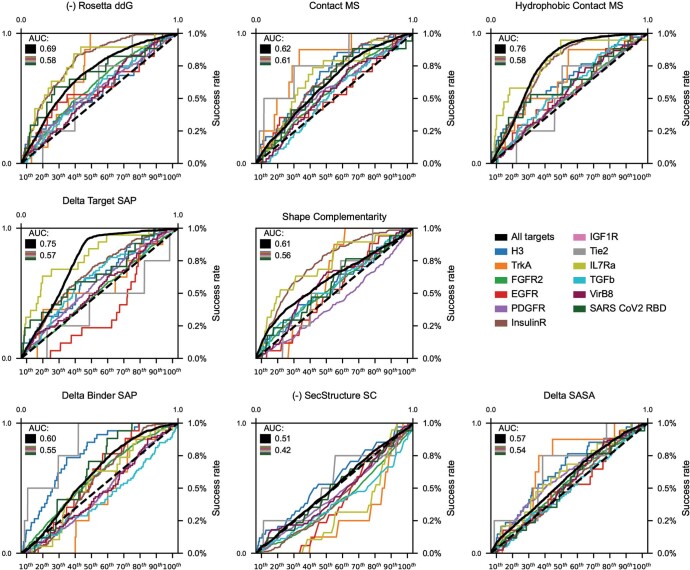
Extended Data Fig. 13. Power of computational metrics to predict binders.
On the fully-relaxed binder dataset (see Methods), the ability of several computational metrics to predict which binders would have SC50 below 4 μM was assessed. In black and in the bar charts, data for all targets were pooled together. The bar charts show the success rate in each of the 10 percentiles for the metric while the black solid line shows the ROC plot for the metric. Each of the colored lines represents the correlation of this metric on each of the targets individually. The AUC of the overall black line is given in the upper left with the median of the AUC of the colored lines given immediately below.

