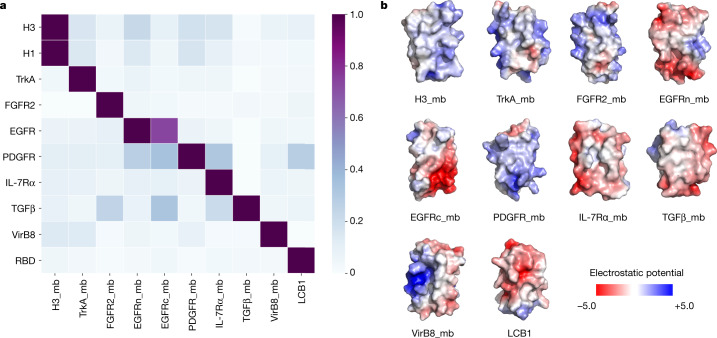
Fig. 4. Designed binders have high target specificity.
To assess the cross-reactivity of each miniprotein binder (mb) with each target protein, biotinylated target proteins were loaded onto biolayer interferometry streptavidin sensors, allowed to equilibrate and the baseline signal set to zero. The biolayer interferometry tips were then placed into 100 nM binder solution for 5 min, washed with buffer, and dissociation was monitored for an additional 10 min. The heat map shows the maximum response signal for each binder–target pair normalized by the maximum response signal of the cognate designed binder–target pair. The raw biolayer interferometry traces are shown in the Supplementary Data 1. b, Surface shape and electrostatic potential (generated with the APBS Electrostatics plugin in PyMOL; red positive, blue, negative) of the designed binding interfaces.

