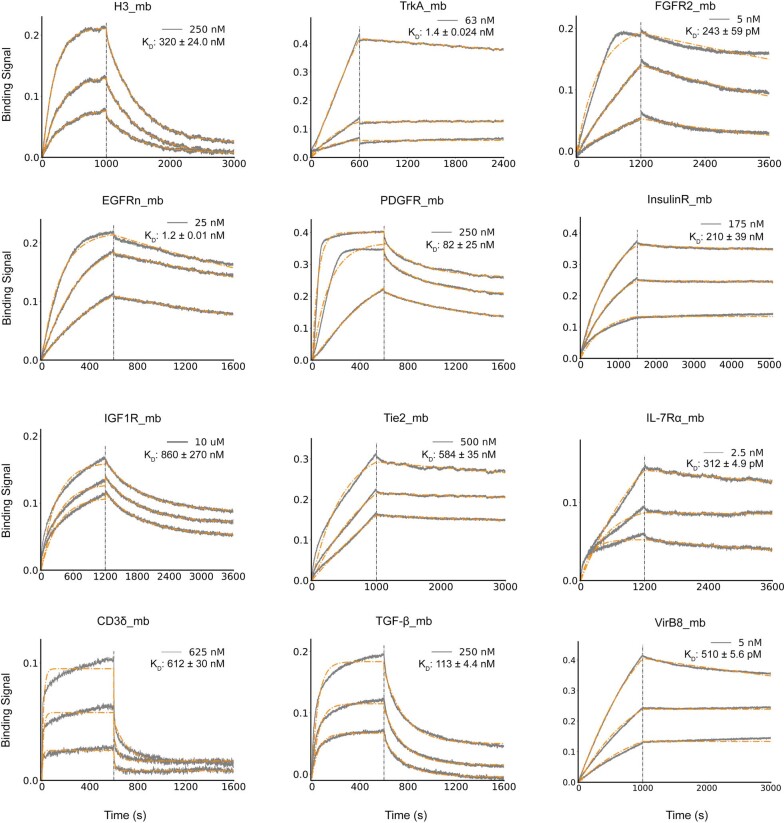
Extended Data Fig. 4. Biolayer interferometry characterization of binding of optimized designs to the corresponding targets.
Two-fold serial dilutions were tested for each binder and the highest concentration is labeled. For H3, TrkA, FGFR2, EGFR, PDGFR, IL-7Rα, CD3δ, TGF-β and VirB8, the biotinylated target proteins were loaded onto the Streptavidin (SA) biosensors, and incubated with miniprotein binders in solution to measure association and dissociation. For IGF1R and Tie2, MBP- (maltose binding protein) tagged miniprotein binders were used as the analytes. For InsulinR, the miniprotein binder was immobilized onto the Amine Reactive Second-Generation (AR2G) Biosensors and the insulin receptor was used as the analyte. The gray color represents experimental data and orange color represents fit curves. The fitting curves are poor at high binder concentrations due to the self- association of the binders through the interface hydrophobic residues, so we only kept the traces and fits at low binder concentrations.

