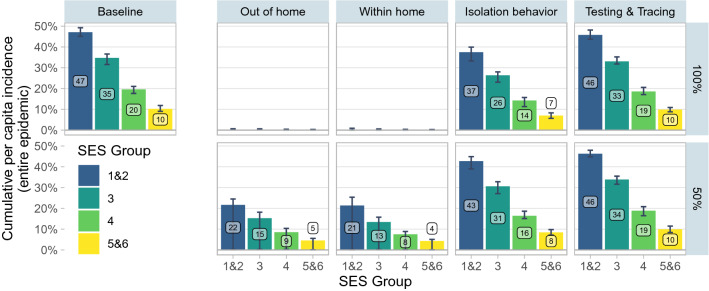
Figure 3.
Upward Adjustment Scenarios. Baseline indicates the model with the parameters of Table 1 and no adjustment. The panels in columns 2 to 6 are the results of upward adjustment scenarios. In the top row of columns 2 to 6 (100% adjustment), the set of parameters indicated in the column heading is adjusted so that all SES have the same value as SES 5&6. In the bottom row (50% adjustment), all SES other than 5&6 have their parameters adjusted to move halfway to the value of 5&6. Parameters adjusted in each set are as follows: out of home (number of contacts outside the home), within home (within-household SAR, household size), isolation behavior (probability of isolating conditional on observing symptoms, testing positive, being contact traced, and probability of quarantining as a household), testing & tracing (probability of self testing, delay in test consultation, delay in test results, and probability of being contact traced). Point estimates denote the median of 50 simulations. Error bars indicate the 0.025 and 0.975 quantiles of the 50 simulations. When the error bars are close to 0, this indicates that some simulated epidemics die out in the very early stages, leading to incidence close to 0.

