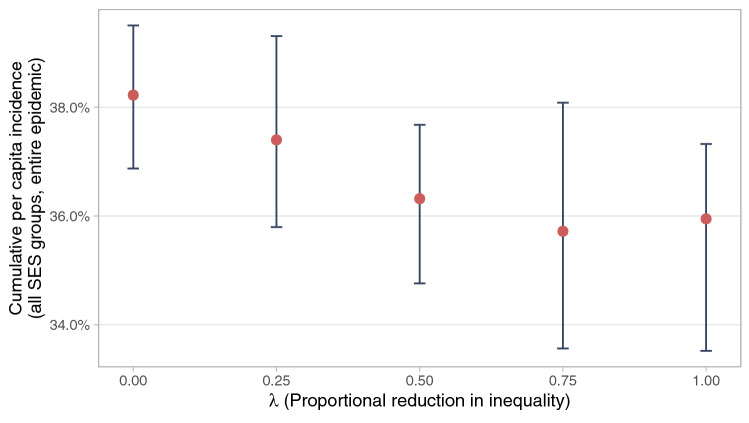
Figure 4.
Mean-preserving reduction in inequalities. Describes the effect of reducing inequalities in all parameters simultaneously while preserving the mean of all parameters. The value of parameter k for an SES j in the baseline simulation can be written as , where is the (population weighted) mean value for the parameter across all groups, and is some deviation. The graph plots the results of adjusting all parameters to the value . The outcome variable is the median cumulative per capita incidence across all SES over the course of the entire simulated epidemic in 50 models with no mobility change. Error bars indicate the 0.025 and 0.975 quantiles of the 50 simulations.

