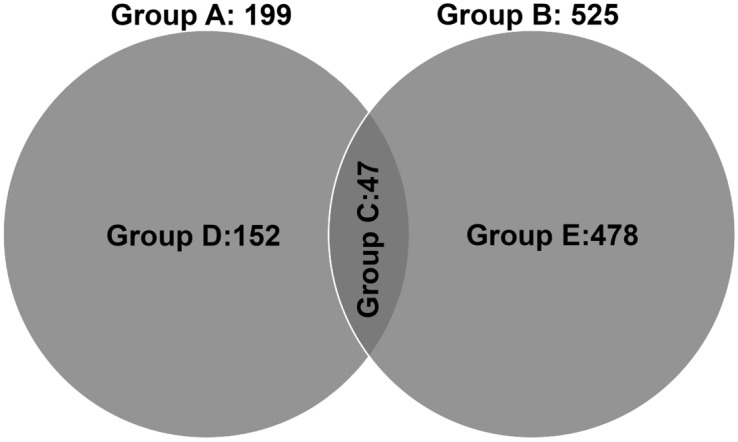
Figure 2.

Venn diagram showing differentially expression groupings. DEGs of RNA seq data identified in different study groups are shown. Only genes with absolute fold change 2 and significant P value < 0.05 were included in these groupings. Group A: DEGs between DEX and ETH treated for short duration (16 h); Group B: DEGs between DEX and ETH treated for longer duration (7 d); Group C: DEGs that overlapping between Group A and Group B; Group D: Uniquely expressed DEGs of HTM cells exposed for 16 h (Group A minus Group C); Group E: Uniquely expressed DEGs of HTM cells exposed for 7 d (Group B minus Group C).
