
Figure 2.
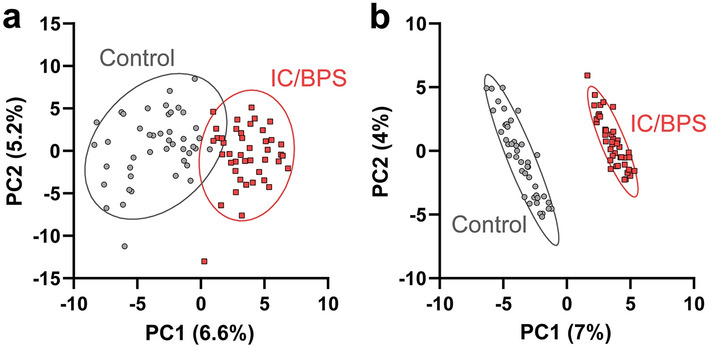
(a) PCA and (b) PLS-DA scores plots of non-targeted LC–MS and LC–MS/MS data after preprocessing and normalization by EigenMS shows separation between IC/BPS patients (red) and healthy controls (grey) based on peptide profiles.
Official websites use .gov
A
.gov website belongs to an official
government organization in the United States.
Secure .gov websites use HTTPS
A lock (
) or https:// means you've safely
connected to the .gov website. Share sensitive
information only on official, secure websites.
(a) PCA and (b) PLS-DA scores plots of non-targeted LC–MS and LC–MS/MS data after preprocessing and normalization by EigenMS shows separation between IC/BPS patients (red) and healthy controls (grey) based on peptide profiles.