Figure 5.

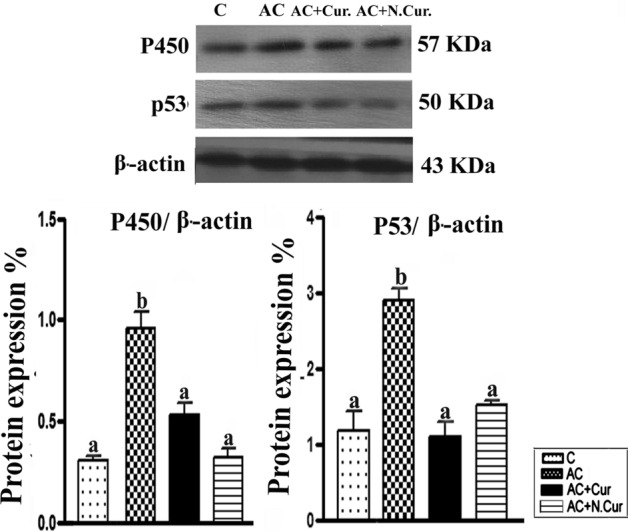
Western blot detection showing changes in protein levels of cytochrome P450 (CYP2E1) and P53. Results expressed as mean ± SEM. Values in the same column with unlike superscript letters are significantly different at p < 0.001.

Western blot detection showing changes in protein levels of cytochrome P450 (CYP2E1) and P53. Results expressed as mean ± SEM. Values in the same column with unlike superscript letters are significantly different at p < 0.001.