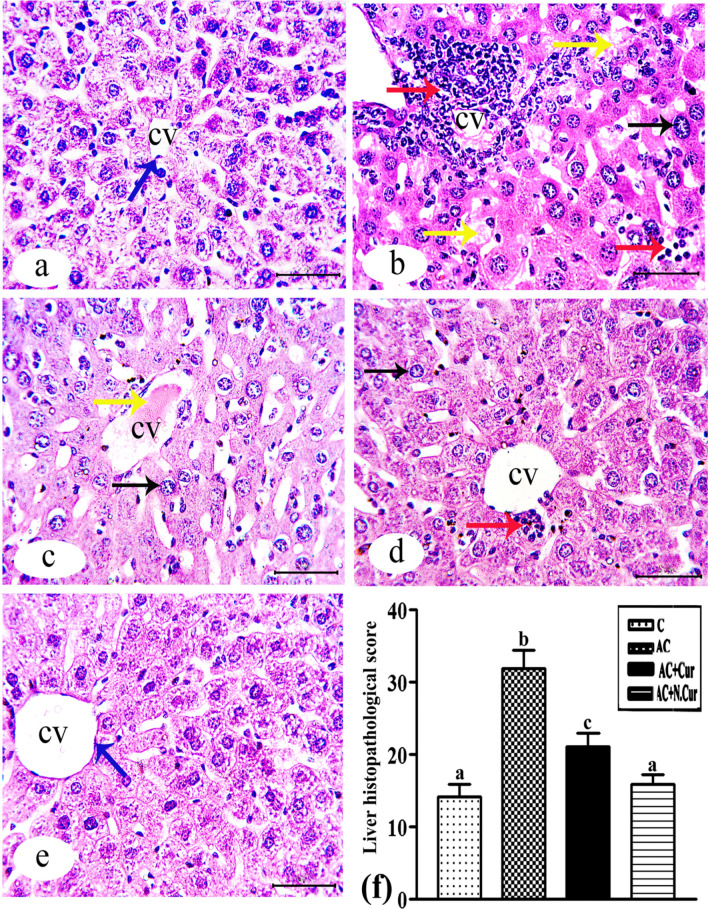
Figure 8.
(a)–(e) Photomicrograph of H&E-stained liver sections from the indicated groups: (a) control male mice, showing the central vein (cv) and obvious appearance of Kupffer cells (blue arrow); (b and c) AC group mice, revealing loss of hepatic architecture, hemorrhage (yellow arrow), inflammation (red arrow), fragmented nuclei (black arrow), multiple ballooned hepatocytes, and vacuolated cytoplasm; (d): AC + Cur group , showing hepatic tissues with more modest cell infiltration (red arrow); (e): AC + NCur group, demonstrating healthy architecture appearance similar to control (H&E Bar = 50 µm). (f) Liver histopathology scores of groups (mean ± SE) and values with different letters are significantly different (p < 0.001).

