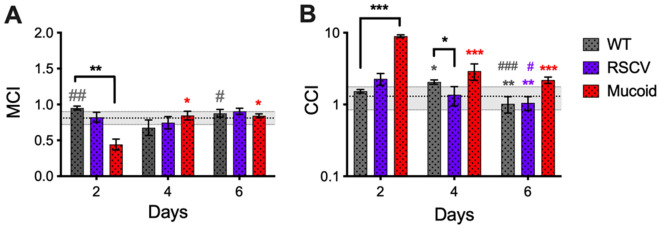
Figure 7.
Mucoid colony-biofilms show reduced mucociliary and cough clearance indices. (a) The MCI and (b) the CCI of P. aeruginosa colony-biofilms was determined according to equations (2) and (3). The lines at (a) 0.81 ± 0.09 and (b) 1.3 ± 0.46 indicate the MCI and CCI of CF sputum respectively determined31. Data presented as mean ± SD, n = 4. Black * indicates comparisons depicted by the line. Coloured * indicates comparisons to 2-d of the given biofilm. *p-value < 0.05, **p-value < 0.01, ***p-value < 0.001, Coloured # indicates comparison to 4-d of the given biofilm. #p-value < 0.05, ##p-value < 0.01, ###p-value < 0.001.

