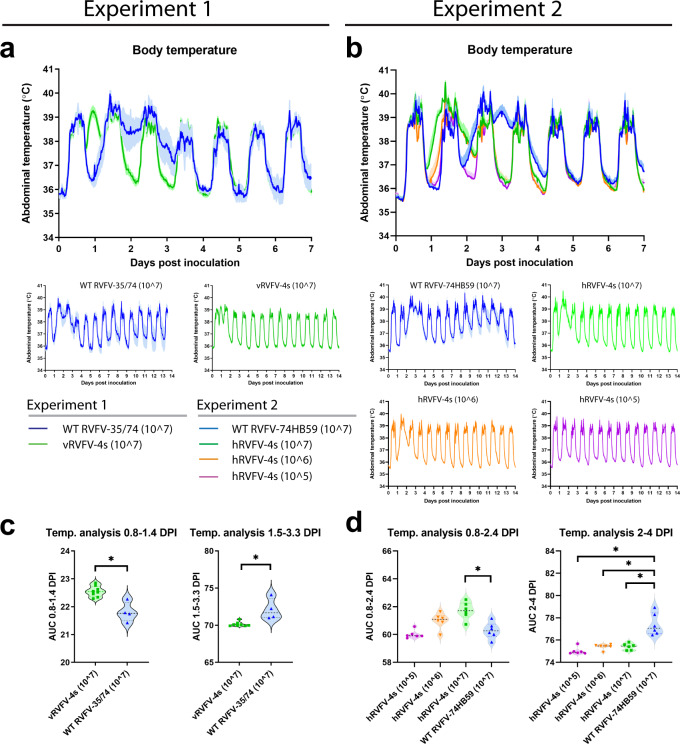
Fig. 3. Dose-dependent early-phase temperature increase following inoculation of marmosets with RVFV-4s.
Body temperatures in experiment 1 (a) and experiment 2 (b) were recorded every 15 min using an AniPill telemetric device in the abdominal cavity. Averages and SEM are presented for each group. Area under the curve (AUC) measurements were performed at the indicated days post inoculation (DPI) to assess statistically significant differences between groups of experiment 1 (c) and, groups of experiment 2 (d). Data are presented as violin plots with medians (dashed line) and were analyzed by (c) unpaired t-test or (d) one-way ANOVA using Dunnett’s multiple comparisons test and comparing the individual vaccine groups to the corresponding wild-type virus groups (GraphPad Prism 9.0). Statistical significance (p value ≤ 0.05) is indicated with an asterisk (*).

