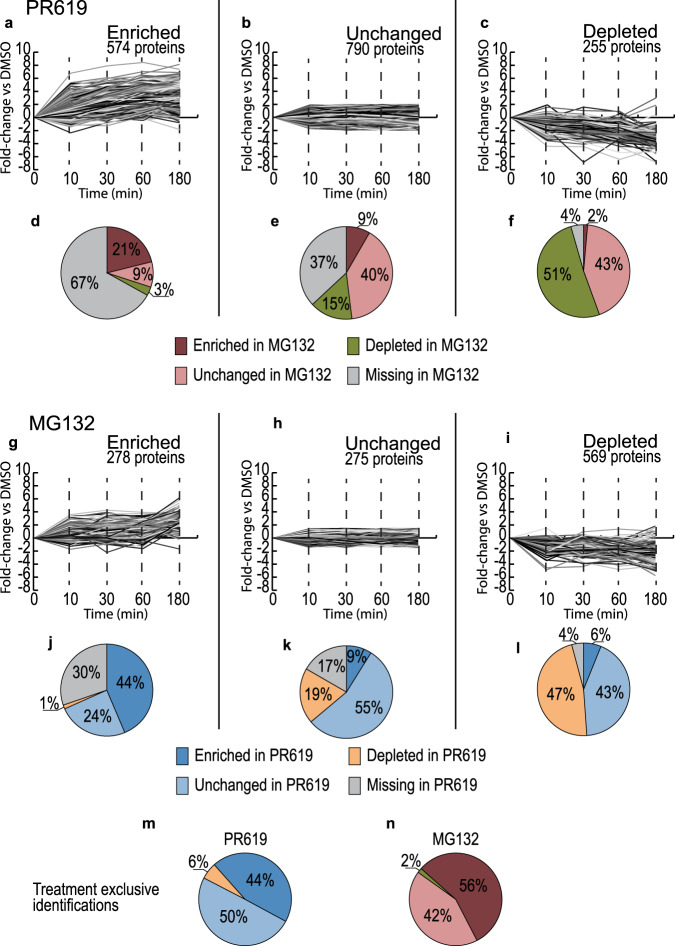
Fig. 3. Large pools of His10-Ub substrates exclusively identified in DUB or proteasome-inhibited samples.
a–c Dynamics of His10-Ub substrates identified in PR619-treated samples grouped based on their fold-change vs DMSO (log2), “Enriched” (>twofold enrichment) (a), “Unchanged” (<twofold enrichment and <twofold depletion) (b) and “Depleted” (>twofold depletion) (c). d–f The His10-Ub groups in PR619-treated samples compared to their grouping in MG132 treated samples with PR619 “Enriched” group distribution in d, “Unchanged” group distribution in e and “Depleted” group distribution in f. g–i Dynamics of His10-Ub substrates identified in MG132 treated samples grouped according to the same criteria with groups “Enriched” (g), “Unchanged” (h) and “Depleted” (i). j–l The His10-Ub groups in MG132 treated samples compared to their grouping in PR619-treated samples with MG132 “Enriched” group distribution in j, “Unchanged” group distribution in k and “Depleted” group distribution in l. m, n Group distributions of proteins exclusively identified in Dub inhibited samples (m) or proteasome-inhibited samples (n). Source data are provided as a Source Data file.

