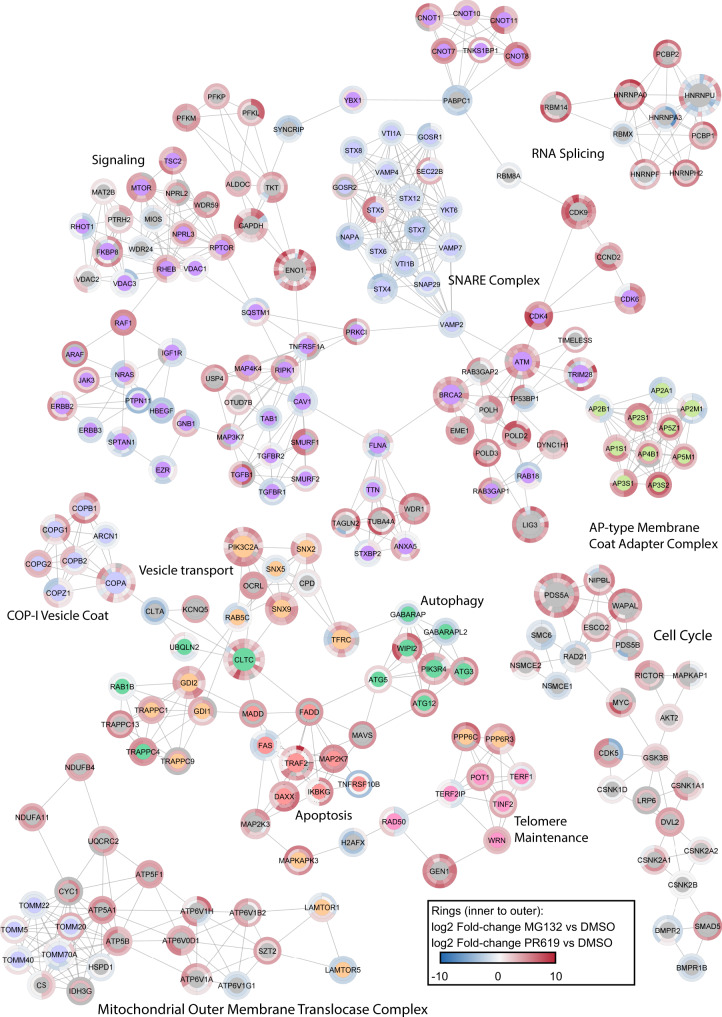
Fig. 5. Ubiquitin signalling networks.
Network analysis of proteins and their Ub sites identified in all five UbiSite DIA replicates of MG132 or PR619-treated cells. Networks were generated using the STRING database of protein-protein interactions (confidence cutoff = 0.9) and subclustered into the most interconnected networks using MCODE (default settings). A functional enrichment was performed on each subcluster with the human genome as background. The most significant biological process or complex is displayed as a title for each subcluster, or colour coded in the node centre for larger subclusters. The dynamics of each Ub site in response to proteasome (MG132) or DUB inhibition (PR619) was colour coded according to the fold-change vs DMSO (log2), where a grey colour indicates that the Ub site was not identified in that treatment. The most N-terminal Ub site is visualised at 12 o’clock of the node, and progresses clockwise to the most C-terminal Ub site at 11 o’clock. The outer ring colour represents PR619 fold-change vs DMSO and the inner ring colour represents MG132 fold-change vs DMSO. The size of the node represents the number of Ub sites identified on that protein. Source data are provided as a Source Data file.

