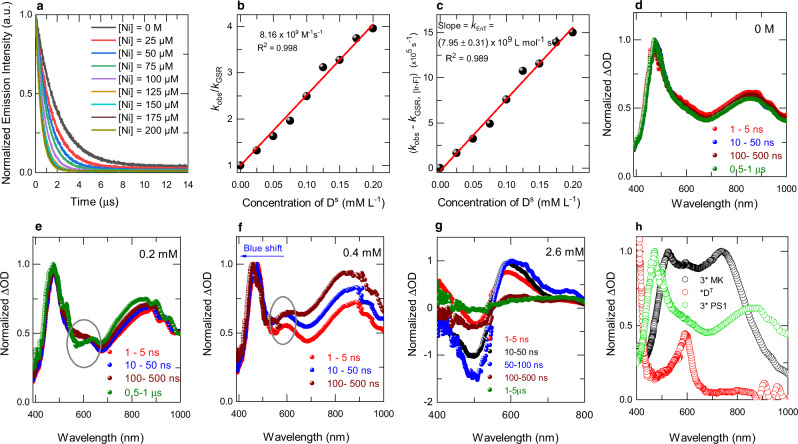
Fig. 5. Excited-state dynamics.
a Reduction of the phosphorescence lifetime of *PS1 upon increasing the concentration of the quencher DS. b Stern-Volmer plot of the phosphorescence lifetime quenching with increasing quencher concentration. c Plot of the observed rate constant (kobs) of *PS1 corrected by the intrinsic ground state recovery rate (kGSR) vs. different concentrations of DS to determine the triplet-triplet EnT rate constant (kTTEnT). d Normalized ns-TA spectra of *PS1 (0.1 mM) in the absence of quencher DS. e, f Normalized ns-TA spectra of a mixture of *PS1 (0.1 mM) and DS (0.2 and 0.4 mM) indicating the formation of *DT at 600 nm. g Normalized ns-TA spectra of a mixture of *PS1 (0.1 mM) and DS (2.6 mM), which shows complete quenching of the photocatalyst by DS, resulting in a new ESA spectral feature at 400 and 600 nm; and a GSB at 500 nm. h Comparison of the decay associated states (DAS) of 3*(Michler’s ketone) (0.1 mM; MK), neat *PS1 (0.1 mM), and the formation of triplet states of nickel (*DT) by energy transfer from 3*MK.

