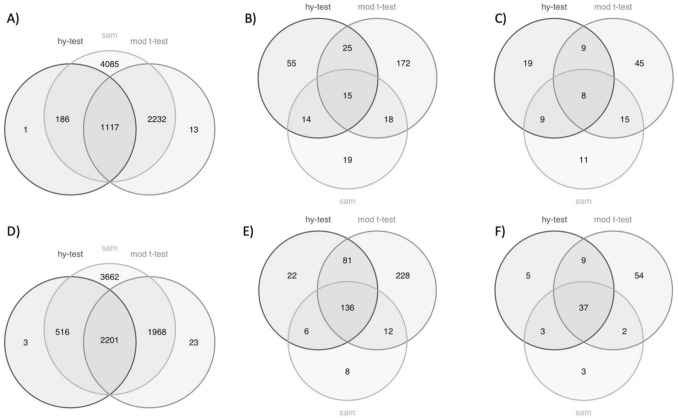
Figure 1.
Venn diagrams of the differentially expressed genes and significant terms found in each of the three analysis steps by the three methods: Hy-test, moderated t-test, and SAM. The upper panels (A, B, C) refer to the breast tissue and the lower panels (D, E, F) to the kidney. The first column (A and D) refers to the DE analysis, the second column (B and E) to the enrichment analysis and the third column (C and F) to the PubMed research. Significance is assessed when a Bonferroni corrected p-value is below the 5% level.

