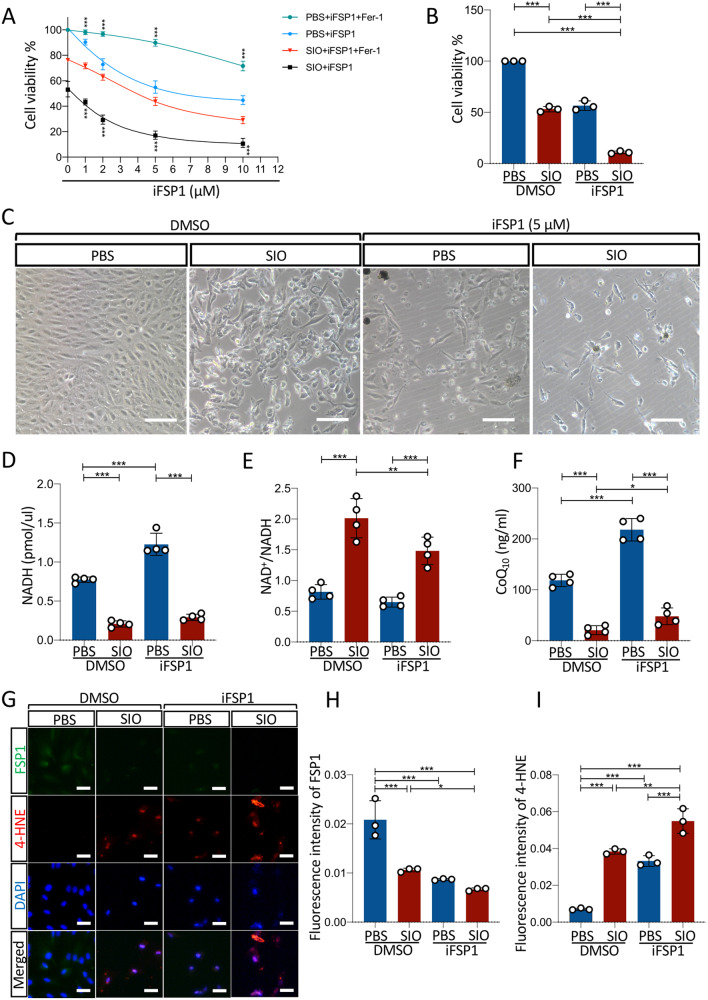
Fig. 5. Inhibition of FSP1 aggravated SIO-induced ARPE-19 cell death through FSP1-CoQ10-NADH pathway.
A CCK-8 cell viability assay results of the effect of iFSP1 on 20 mM SIO-induced ARPE-19 cell death. n = 3 (independent experiments). B CCK-8 cell viability assay results of the effect of 5 µM iFSP1 on 20 mM SIO-induced ARPE-19 cell death. n = 3 (independent experiments). C Phase-contrast microscope images of cell morphology of SIO-exposed ARPE-19 cells with/without iFSP1 treatment are shown. Scale bar = 100 µm. D NADH level of SIO-induced ARPE-19 cell death with/without iFSP1 treatment. n = 4 (independent experiments). E NAD+/NADH ratio of SIO-induced ARPE-19 cell death with/without iFSP1 treatment. n = 4 (independent experiments). F CoQ10 level of ARPE-19 in SIO-induced RPE degeneration with/without iFSP1 treatment. n = 4 (independent experiments). G FSP1 and 4-HNE immunofluorescence signals in SIO-exposed ARPE-19 cells with or without FSP1 DNA transfection ARPE-19 Scale bar = 50 µm. H Quantitative analysis of the fluorescent intensity of FSP1. n = 3 (independent experiments). I Quantitative analysis of the fluorescent intensity of 4-HNE. n = 3 (independent experiments). *p < 0.05, **p < 0.01, ***p < 0.001.

