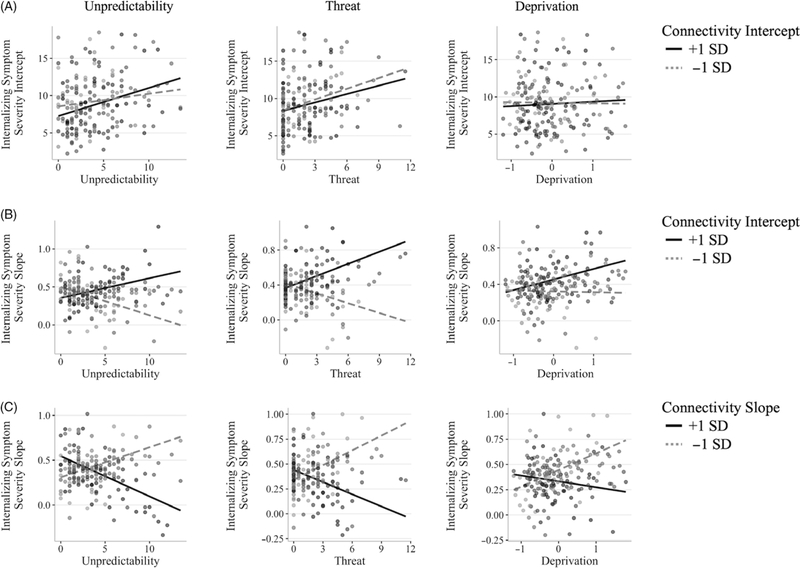
Figure 6.
Network connectivity trajectories moderate associations between dimensions of adversity and trajectories of internalizing symptoms. (a) Higher levels of unpredictability and threat were associated with higher initial levels (i.e., intercepts) of internalizing symptoms; initial levels of average connectivity across networks (FPN, DMN, SAL, and between these networks) did not moderate these associations. (b) Higher unpredictability was associated with increases in internalizing symptoms over time when initial connectivity was higher; a negative association between unpredictability and internalizing symptom slopes was found when initial connectivity was lower. Similarly, threat was positively associated with internalizing slopes when initial connectivity was higher; a negative association between threat and internalizing slopes was found when initial connectivity was lower. There was no association between deprivation and internalizing symptom severity slopes, and connectivity intercepts did not moderate this non-association. (c) All dimensions of adversity were associated with increases in internalizing severity when connectivity slopes were lower (i.e., greater decreases); however, in participants with higher connectivity slopes (i.e., less decreases), greater adversity was related to decreases in internalizing symptoms over time. All adversity dimensions are grouped only for visualization (mean ± 1 standard deviation). All models included sex, head motion (average framewise displacement), and fieldmap correction group as covariates of no interest. The model measuring the interactions of adversity and connectivity intercept and slope on slopes of internalizing symptoms included the internalizing intercept as a covariate.

