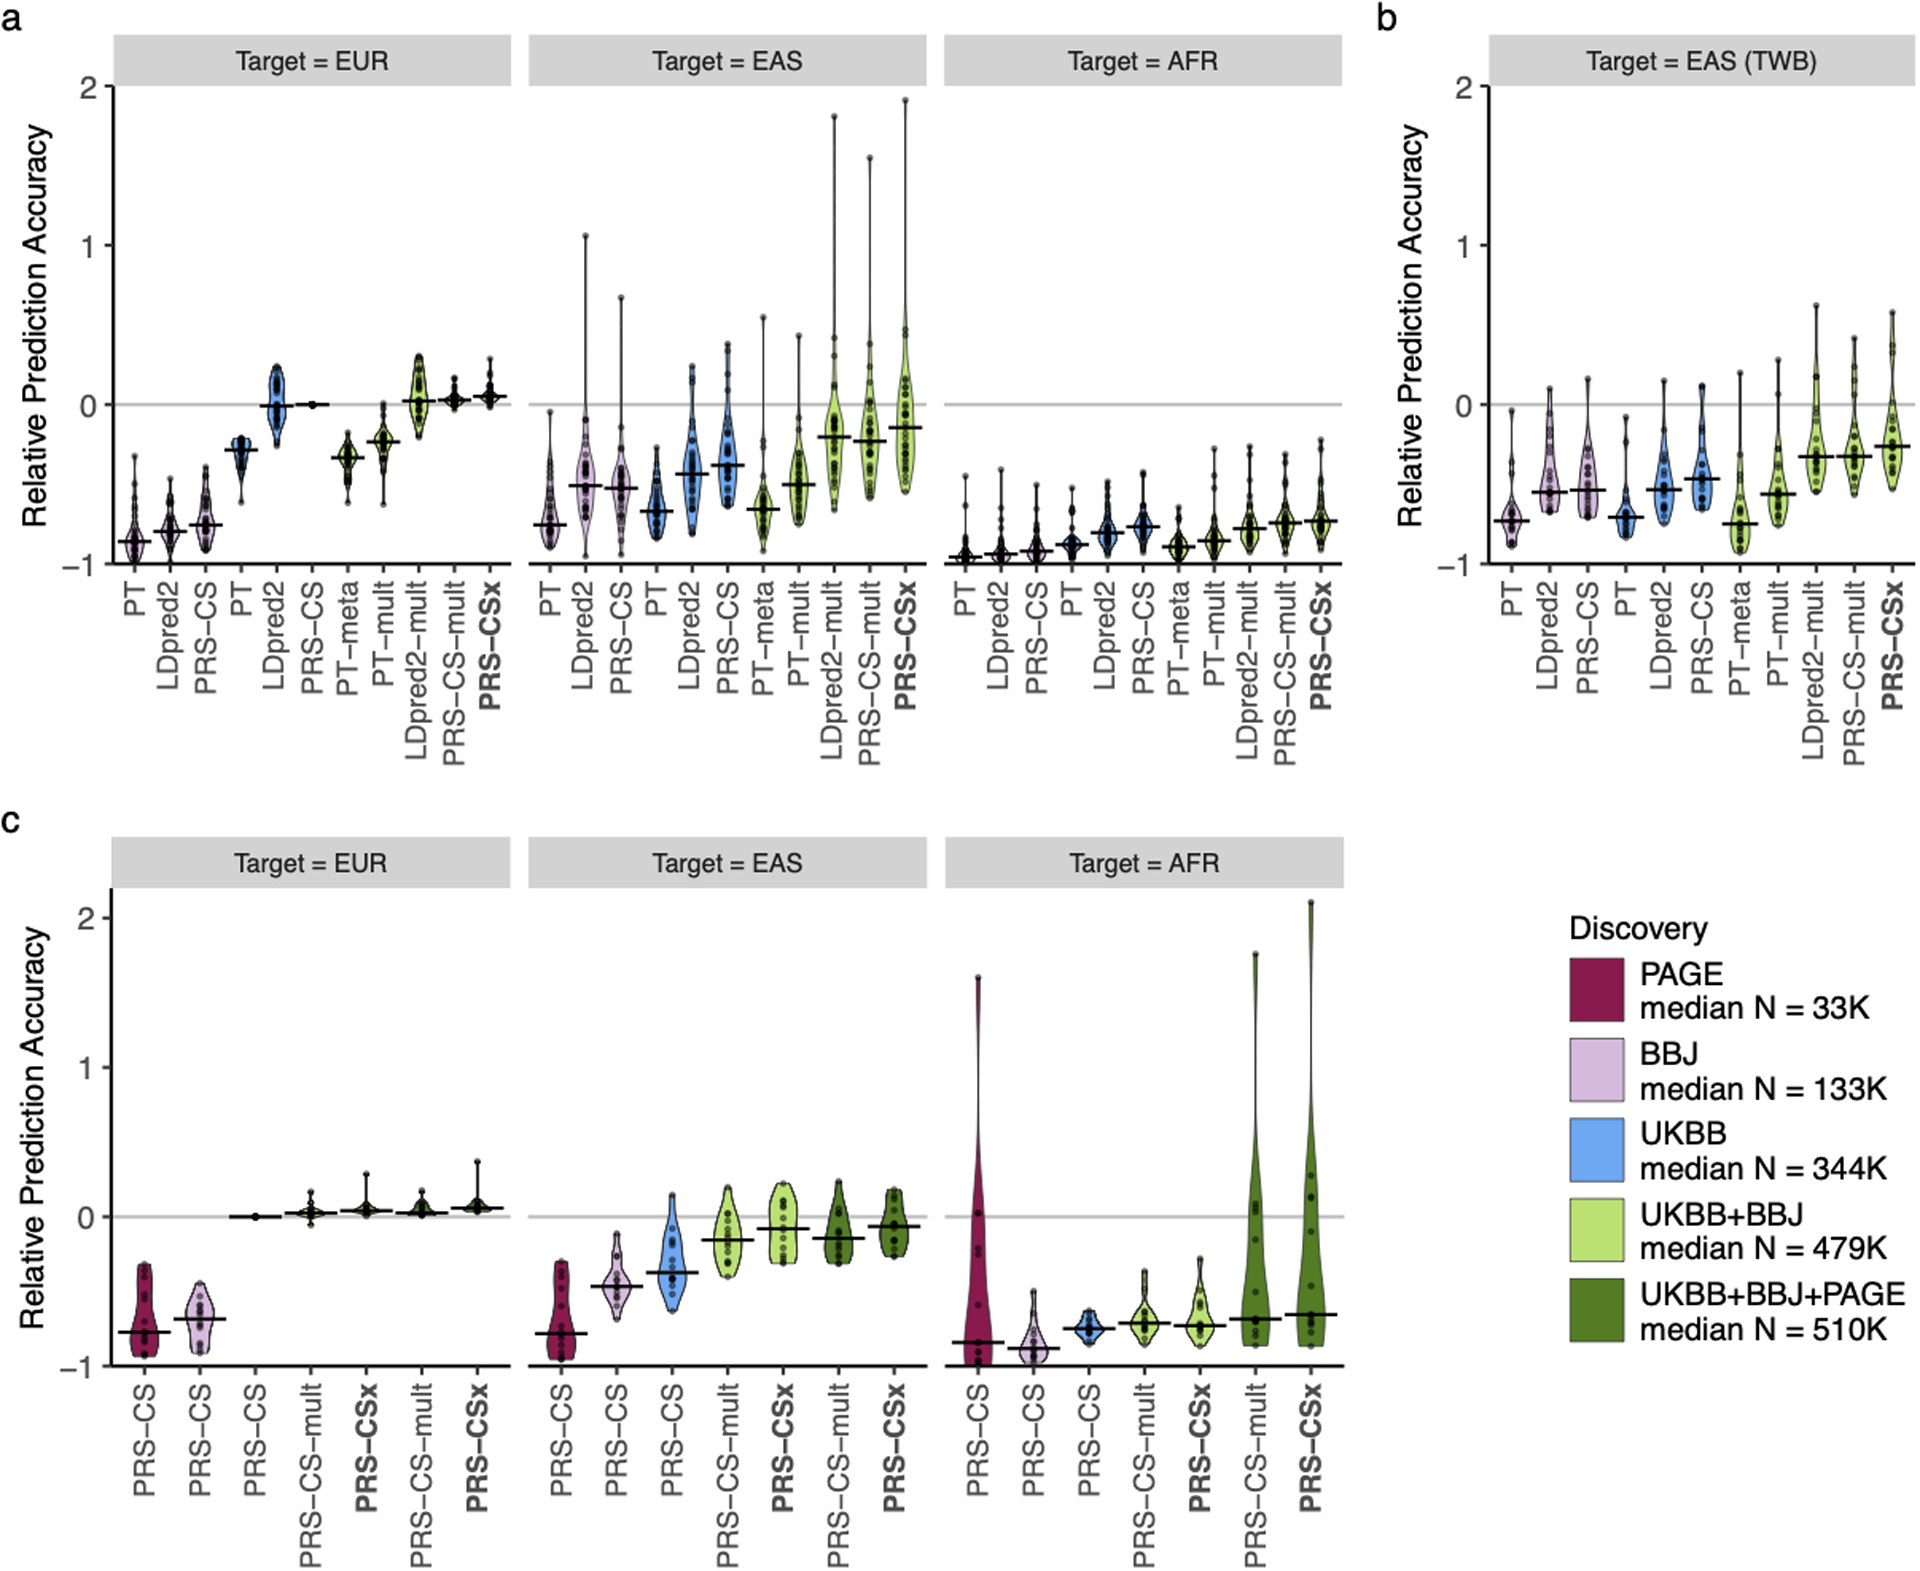
Extended Data Fig. 8. Relative prediction accuracy for quantitative traits across target populations.

Relative prediction performance for single-discovery and multi-discovery PRS construction methods using discovery GWAS summary statistics a, from UKBB and BBJ, across 33 traits, in different UKBB target populations (EUR, EAS and AFR); b, from UKBB and BBJ, across 21 traits, in the Taiwan Biobank (TWB); c, from UKBB, BBJ and PAGE, across 14 traits, in different UKBB target populations (EUR, EAS and AFR). Each data point shows the relative increase of prediction performance, defined as R2/R2PRS-CS (UKBB)-EUR - 1, in which R2PRS-CS (UKBB)-EUR is the R2 of the trait in the EUR population using PRS-CS trained on the UKBB GWAS summary statistics. In UKBB target populations (panels a and c), R2 were averaged across 100 random splits of the target samples into validation and testing datasets. The crossbar indicates the median of the relative increase of predictive performance across the traits examined. “median N” indicates the median sample size across the respective discovery GWAS.
