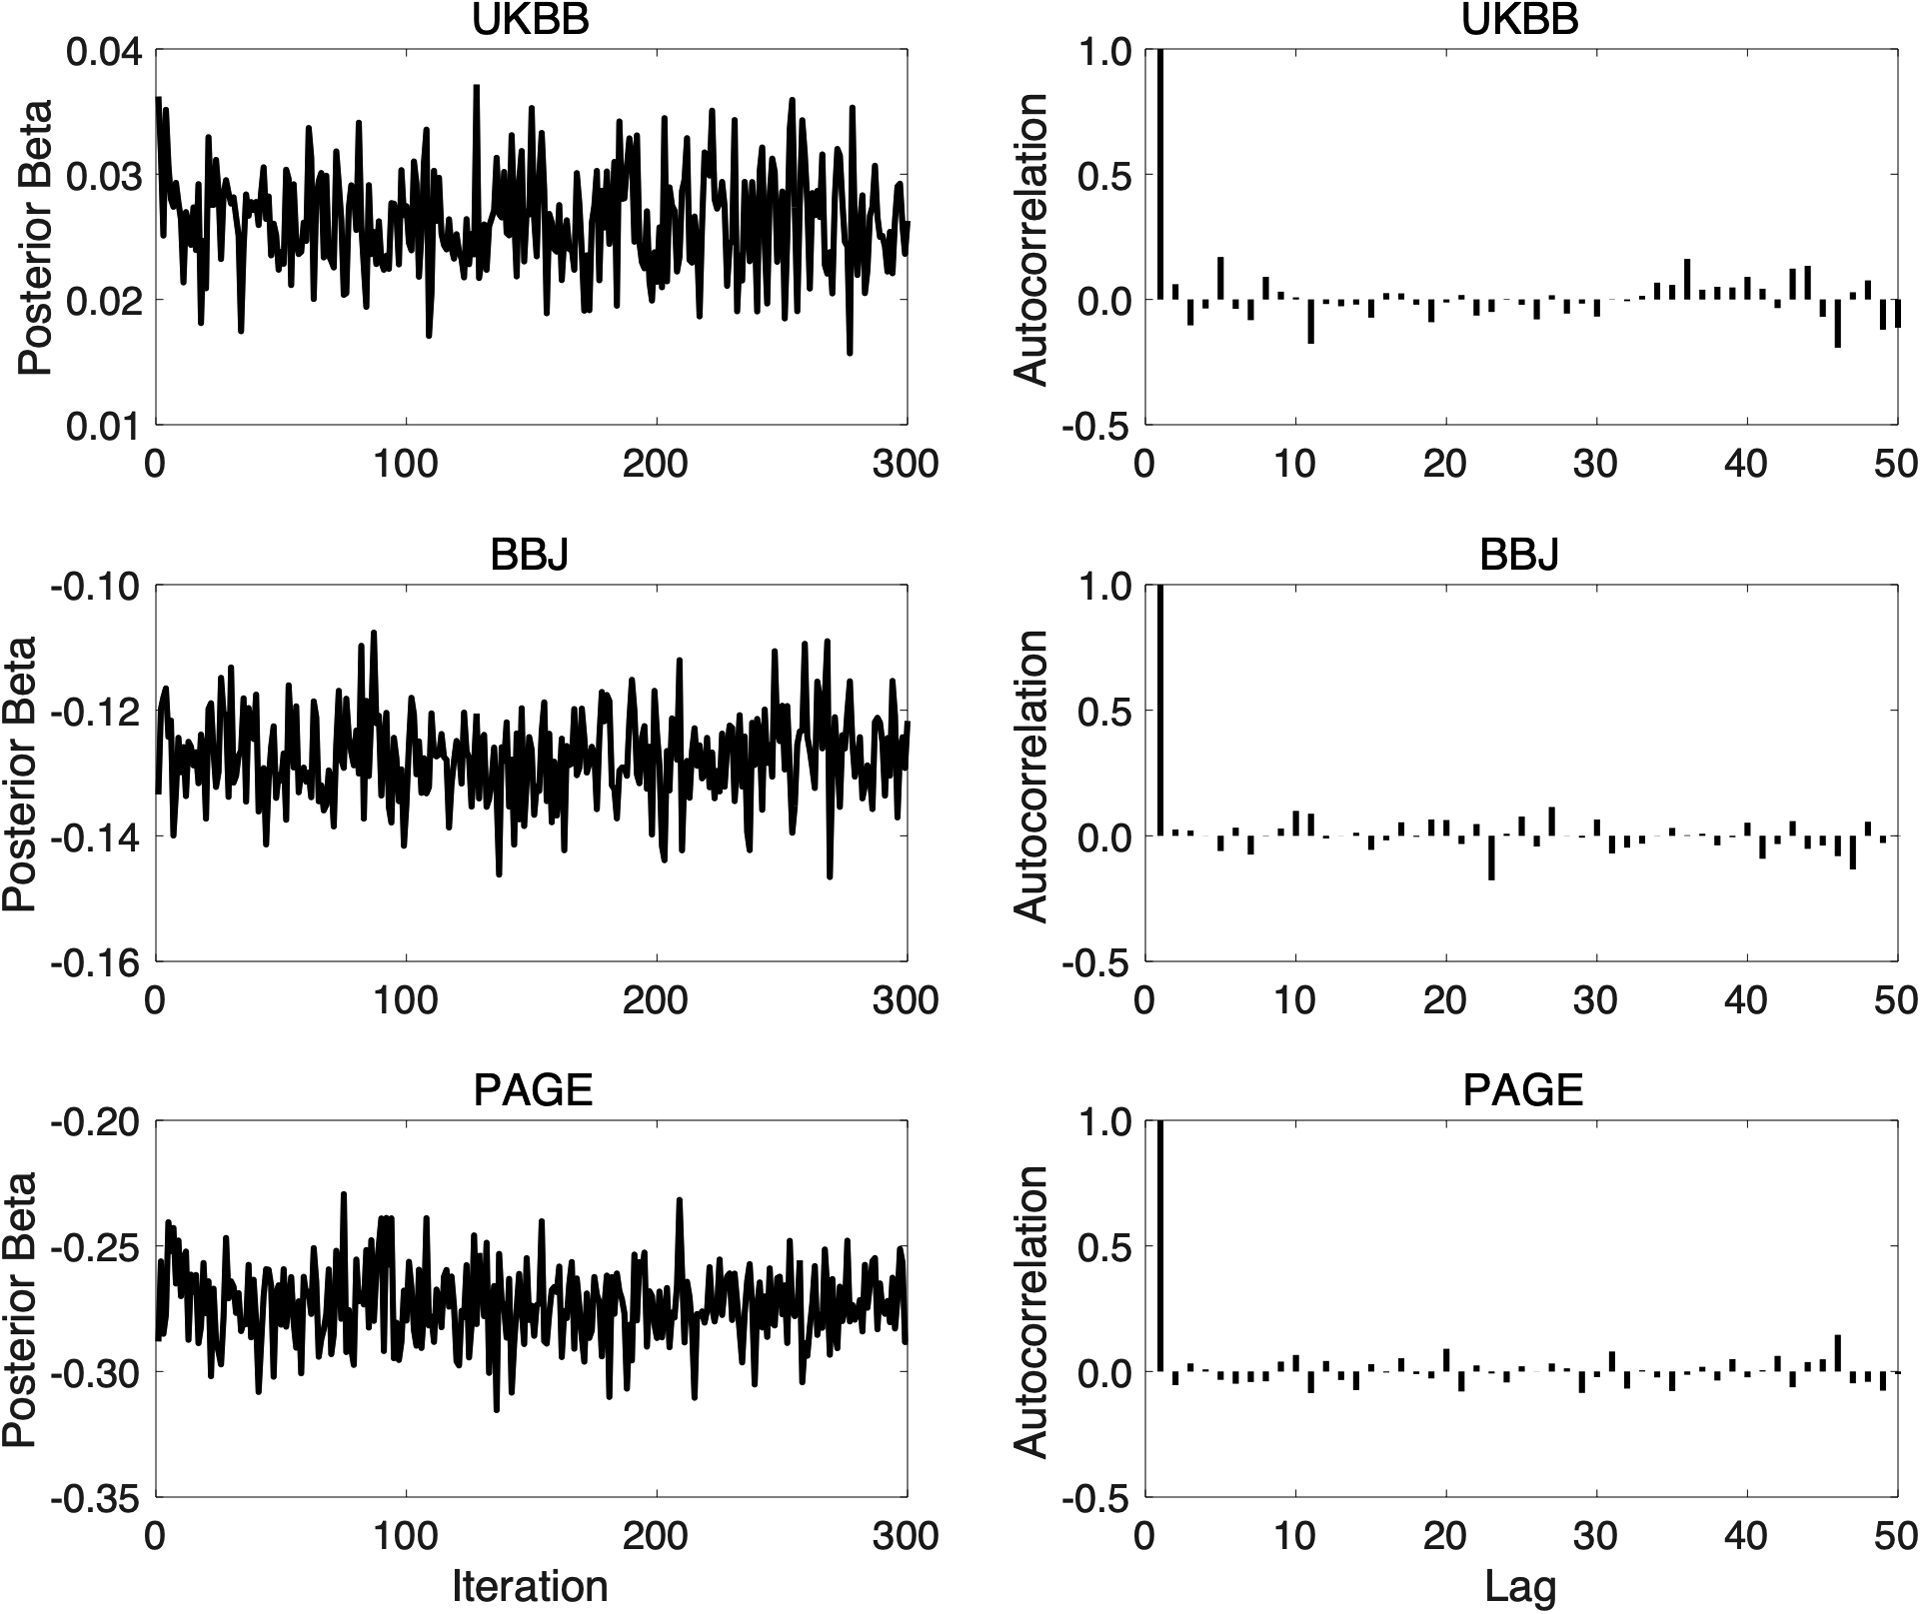
Extended Data Fig. 9. Trace plots and autocorrelation functions (ACFs) for assessing the convergence and mixing of the Gibbs sampler used in PRS-CSx.

Left panels: Trace plots, after discarding the burn-in iterations and thinning the Markov chain by a factor of 5, for the posterior effects of rs7412 on low-density lipoprotein cholesterol when integrating UKBB, BBJ and PAGE GWAS summary statistics using PRS-CSx. Right panels: The autocorrelation functions (ACFs) for the traces shown on the left.
