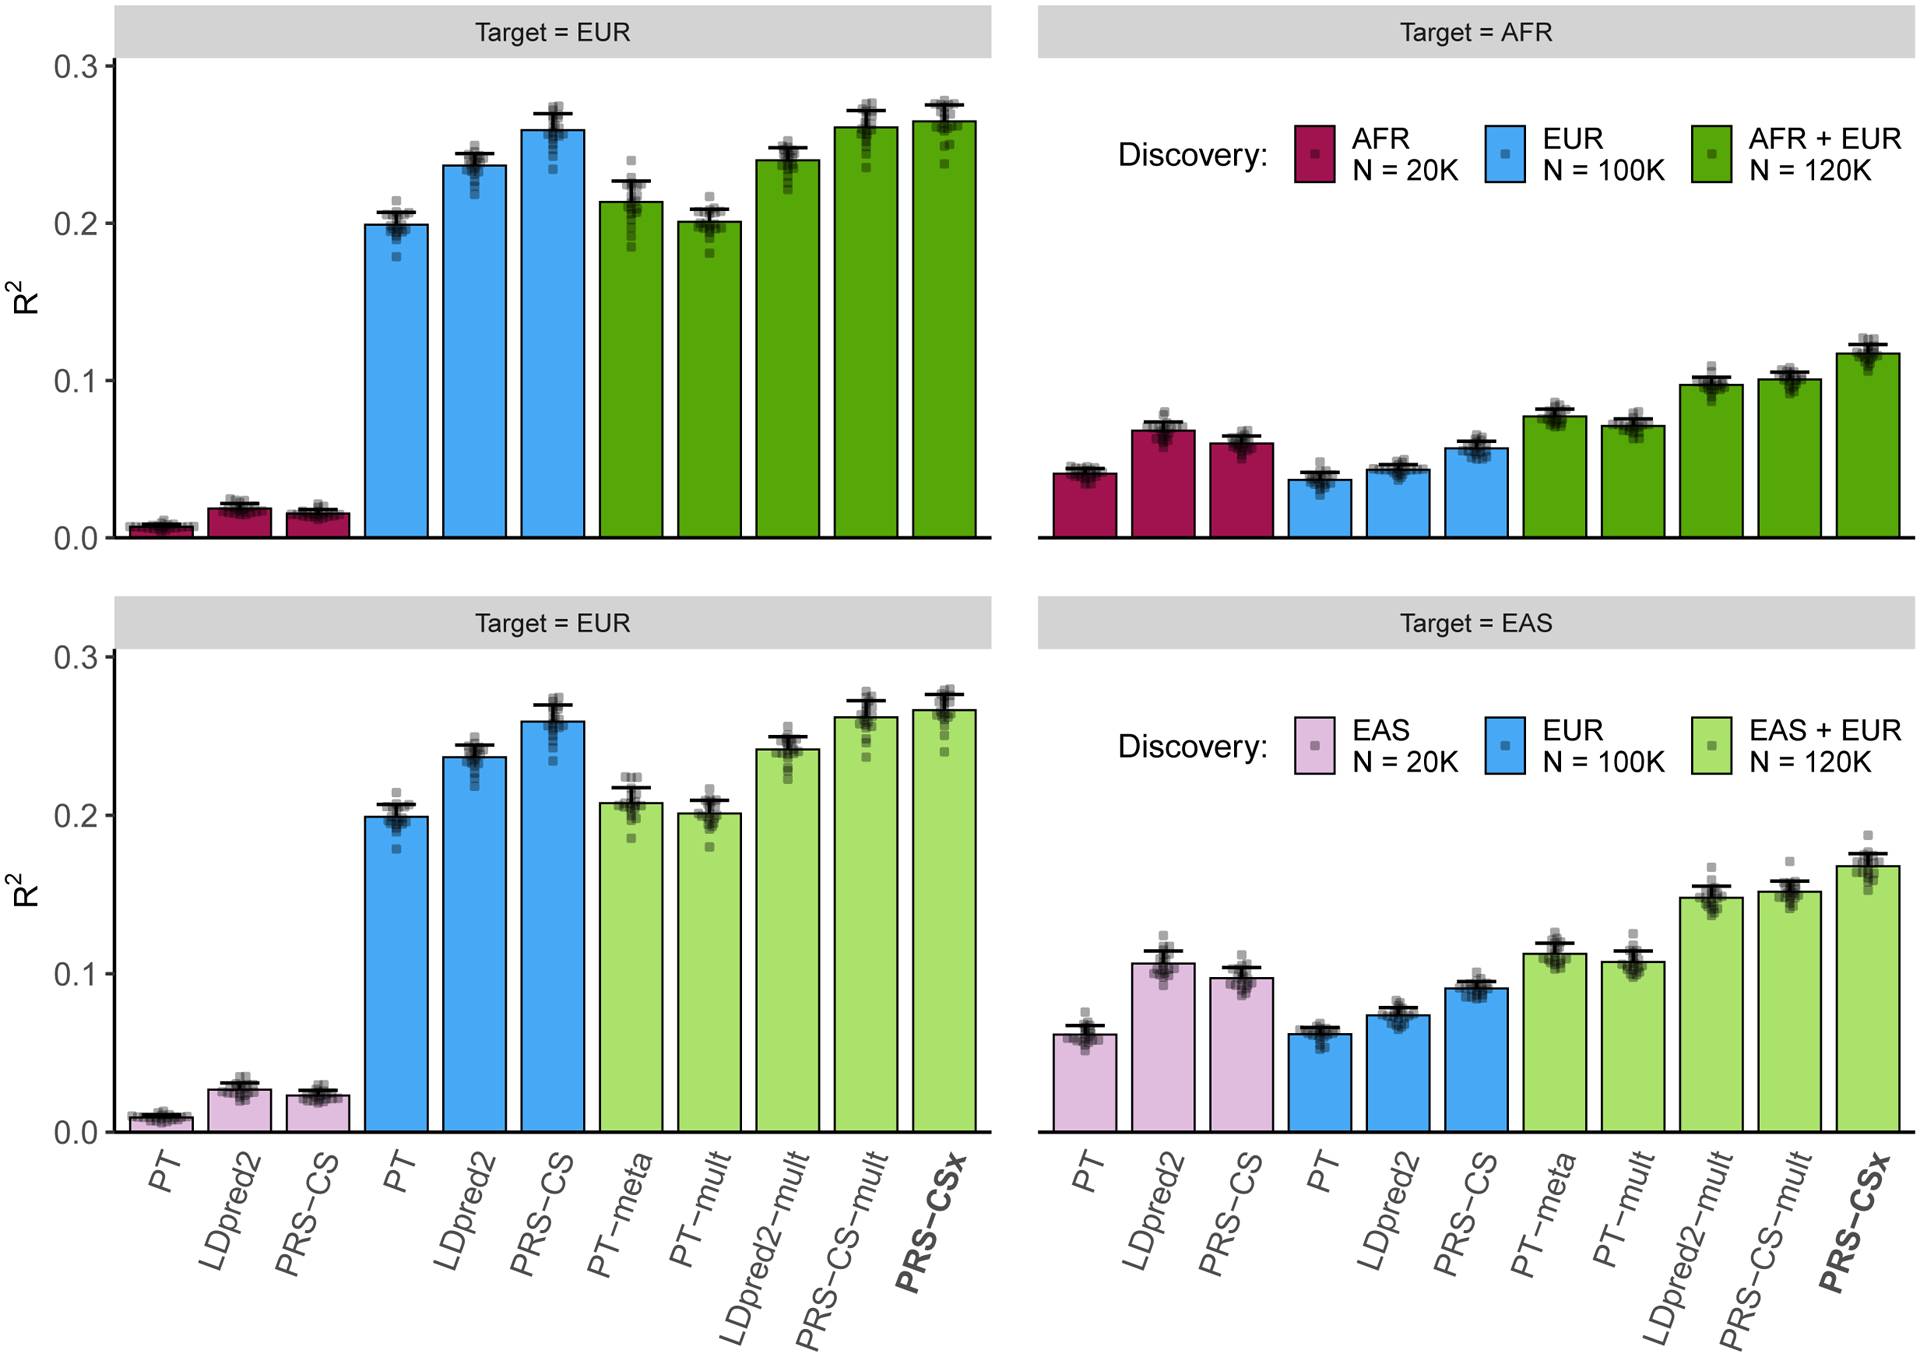
Figure 2: Prediction accuracy of single-discovery and multi-discovery polygenic prediction methods in simulations.

1% HapMap3 variants were randomly sampled as causal variants, which in aggregation explained 50% of phenotypic variation in each population. Causal variants were shared across populations with a cross-population genetic correlation of 0.7. 100K simulated EUR samples and 20K non-EUR (EAS or AFR) samples were used as the discovery dataset. Each bar shows the squared correlation (R2) between the simulated and predicted phenotypes for a polygenic prediction method in an independent testing dataset, averaged across 20 simulation replicates. Error bar indicates the standard deviation of R2 across replicates. Prediction accuracy for each simulation replicate is overlaid on the bar plot.
