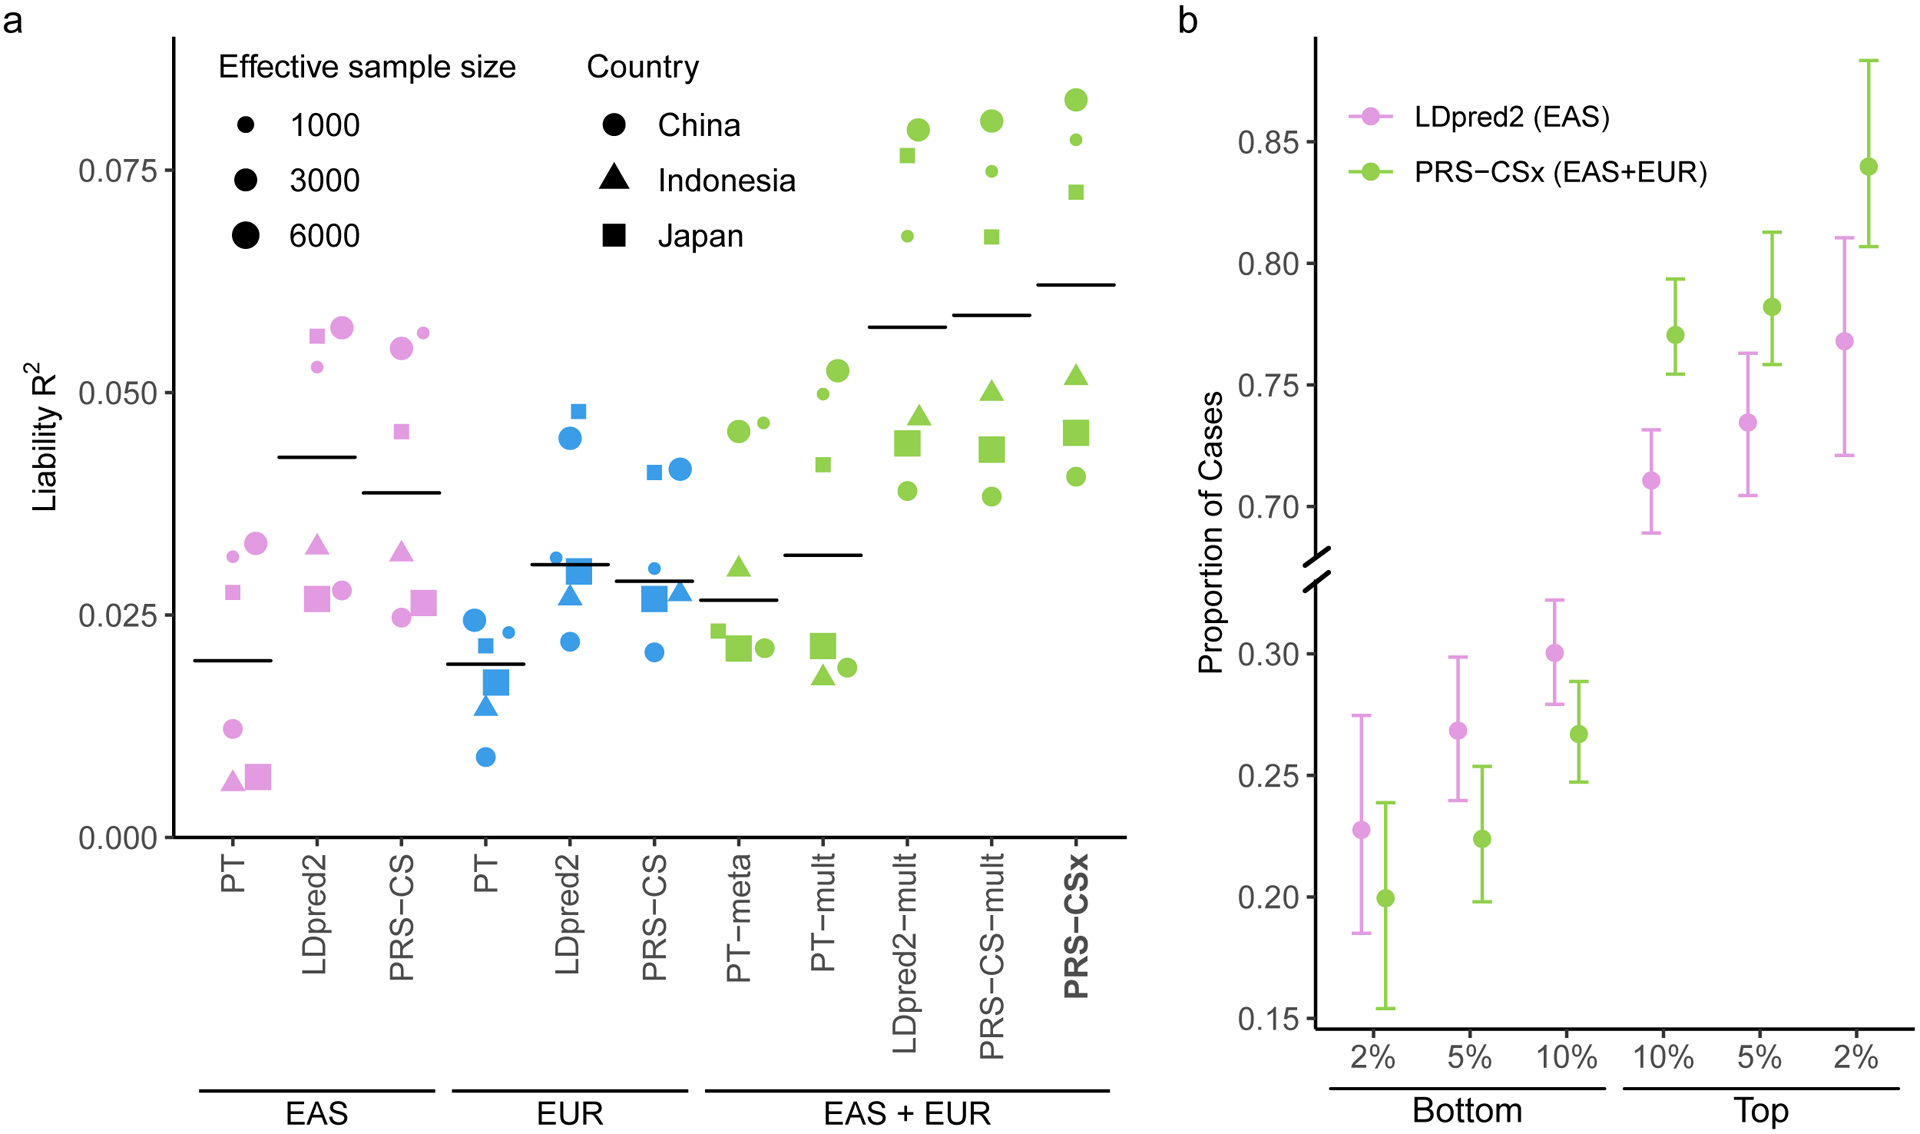
Figure 4: Prediction accuracy of schizophrenia risk in EAS cohorts.

a, Prediction accuracy, measured as variance explained (R2) on the liability scale, of single-discovery (trained on EAS or EUR GWAS) and multi-discovery polygenic prediction methods (trained on both EAS and EUR GWAS: EAS+EUR) across 6 EAS schizophrenia cohorts. Each dot represents one testing cohort, with the size of the dot being proportional to its effective sample size, calculated as 4/(1/Ncase+1/Ncontrol), and the shape of the dot representing the country where the sample was collected. Crossbar indicates the median R2 on the liability scale. b, The center of the error bar shows the proportion of schizophrenia cases of the bottom 2%, 5%, 10% and top 2%, 5%, 10% of the PRS distribution, constructed by LDpred2 trained on EAS GWAS (the best-performing single-discovery method) and PRS-CSx (the best-performing multi-discovery method), across 6 EAS schizophrenia cohorts (9,416 cases, 8,708 controls). Error bar indicates 95% confidence intervals.
