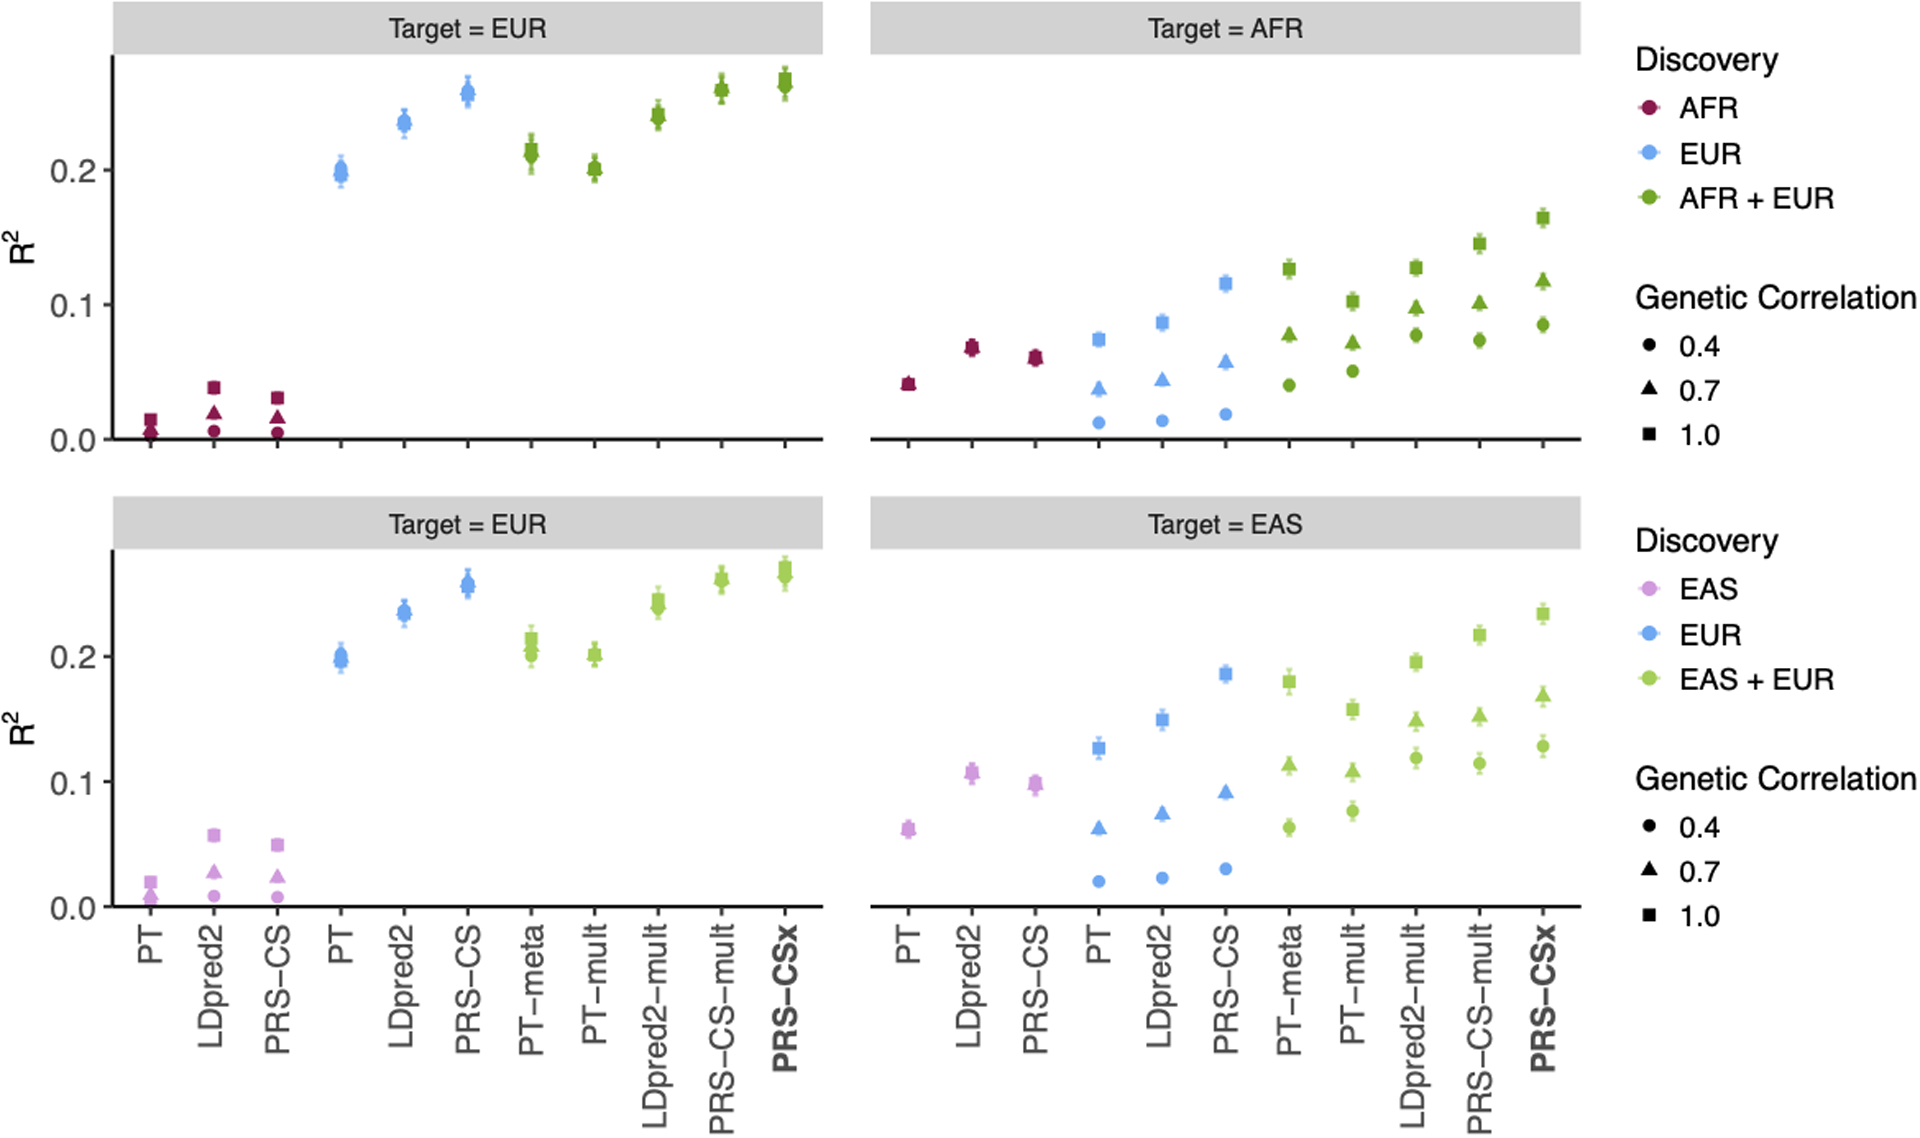
Extended Data Fig. 2. Prediction accuracy of different polygenic prediction methods across different cross-population genetic correlations.

Phenotypes were simulated using 1% of randomly sampled causal variants (shared across populations), a cross-population genetic correlation of 0.4, 0.7 or 1.0, and SNP heritability of 50%. PRS were trained using 100K EUR samples and 20K non-EUR (EAS or AFR) samples. Numerical results are reported in Supplementary Table 3.
