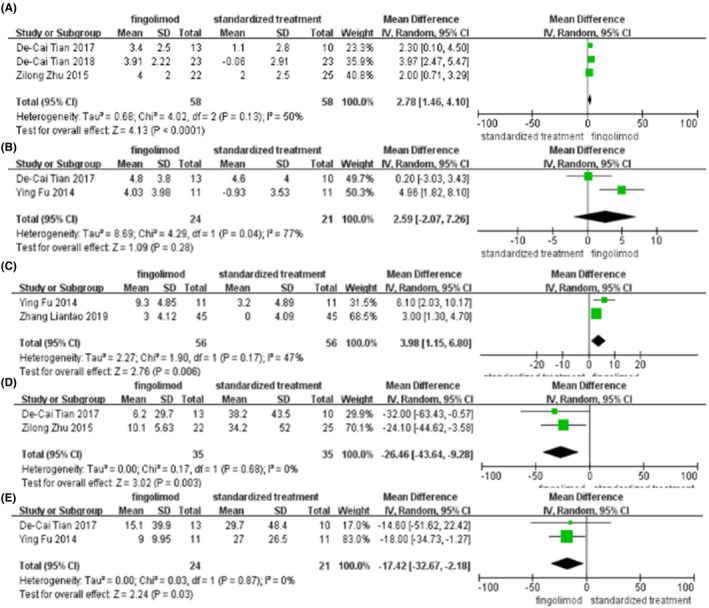
FIGURE 4.

(A) Forest plot of the mean difference in the change in NIHSS score at 24 h, (B) NIHSS score at day 7, (C) CNIHSS score at day 90, (D) relative infarct lesion growth at 24 h, (E) relative infarct lesion growth at day 7 between fingolimod plus standardized treatment and standardized treatment alone.
