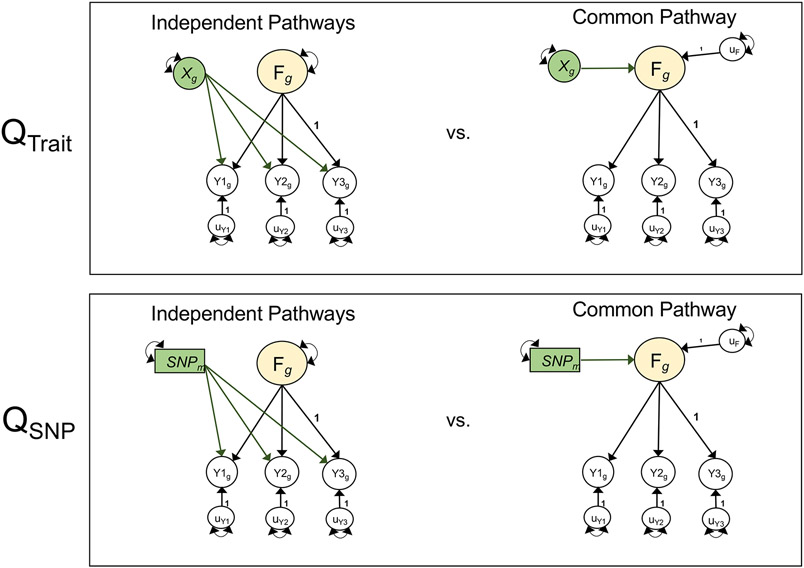
Figure 2 ∣. Model comparisons for producing Q metrics.
Unstandardized path diagrams for common pathway (right) and independent pathways (left) models used to compute the Genomic SEM heterogeneity statistics for associations with external traits (QTrait, top) and individual SNPs (QSNP, bottom). In this example, F is a common genetic factor of the genetic components of three GWAS phenotypes (Y1-Y3). Observed variables are represented as squares, and latent variables are represented as circles. The genetic component of each phenotype is represented with a circle as the genetic component is a latent variable that is not directly measured, but is inferred using LDSC. SNPs are directly measured, and are therefore represented as squares. Single-headed arrows are regression relations, and double-headed arrows are variances. Paths labeled 1 are fixed to 1 for model identification purposes. All unlabeled paths represent freely estimated model parameters. Q represents the decrement in model fit of the common pathway model relative to the more restrictive independent pathways model. Q is a χ2 distributed test statistic with k − 1 degrees of freedom, representing the difference between the k SNP-phenotype or Trait-phenotype b coefficients in the independent pathways model and the 1 SNP-factor or Trait-factor b coefficient in the common pathway model. Q is estimated here using a χ2 difference test across the common and independent pathways models; this is statistically equivalent to the 2-step procedure outlined in the original Genomic SEM13 publication for calculating QSNP. QTrait indexes whether the pattern of genetic associations between the genetic component of an external trait (depicted as Xg) and the individual disorders is well accounted for by a given factor. QSNP indexes whether the associations between an individaul SNP (depicted as SNPm) and the individual dissorders is well accounted for by the factor. For simplicity, we depict a stylized representation containing only one factor and three disorders. The full models used to derive QTrait and QSNP for the empirical analyses reported in this paper are presented in Supplementary Figures 5 and 38.

