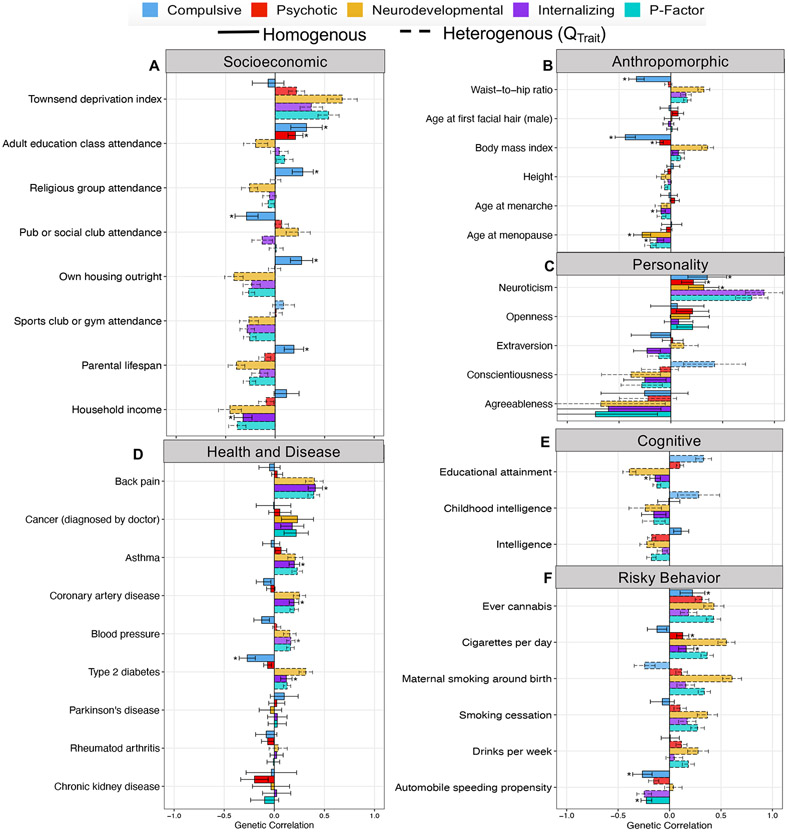
Figure 3 ∣. Genetic correlations with complex traits across psychiatric factors.
a-f, Panels depict point estimates for genetic correlations with complex traits of interest for the four psychiatric factors from the correlated factors model and the second-order, p-factor from the hierarchical model. Genetic correlations are shown for socioeconomic (a), anthropromorphic (b), personality (c), health and disease (d), cognitive (e), and risky behavior outcomes (f). Bars depicted with a dashed outline were significant at a Bonferroni-corrected threshold for model comparisons indicating heterogeneity across the factor indicators in their genetic correlations with the outside trait. Error bars are +/− 1.96 SE. Bars depicted with an asterisk above produced a genetic correlation that was significant at a Bonferroni-corrected threshold and were not significantly heterogeneous. The total effective sample size for the factors was: Compulsive factor (n = 19,108), Psychotic factor (n = 87,138), Neurodevelopmental factor (n = 55,932), Internalizing factor (n = 455,340), and hierarchical p-factor (n = 667,343). Sample sizes for the complex traits are reported in Supplementary Table 5.

