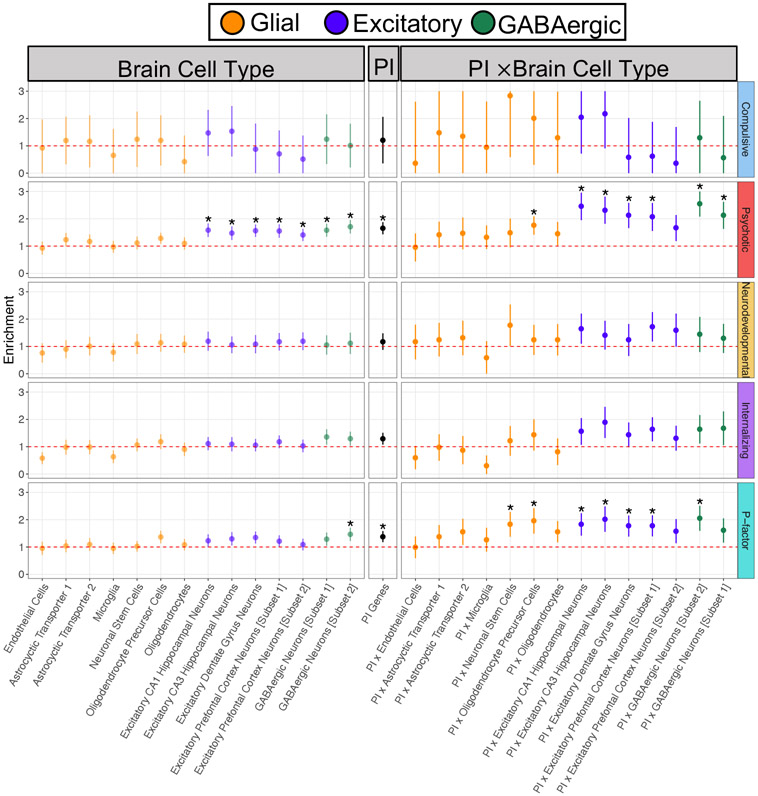
Figure 5 ∣. Genetic enrichment of factors for brain cell, PI, and PI × brain cell annotations.
Figure depicts enrichment of the four factors from correlated factors model and the second-order, p-factor from the hierarchical factor model for the brain cell genes, protein-truncating variant (PTV)–intolerant (PI) genes, and PI × brain cell gene annotations. Enrichment is indexed by the ratio of the proportion of genome-wide relative risk sharing indexed by the annotation to that annotation’s size as a proportion of the genome. The red dashed line reflects the null ratio of 1.0, corresponding to no enrichment. Ratios greater than 1.0 indicate enrichment of shared signal, whereas ratios less than 1.0 indicate depletion of shared signal. Error bars depict 95% confidence intervals. Points depicted with an asterisk were significantly enriched at a Bonferroni-corrected threshold. To maintain equal scaling purposes across all panels, error bars are capped at 3 and 0 for the Compulsive disorders factor; no annotations were significant for this factor.

