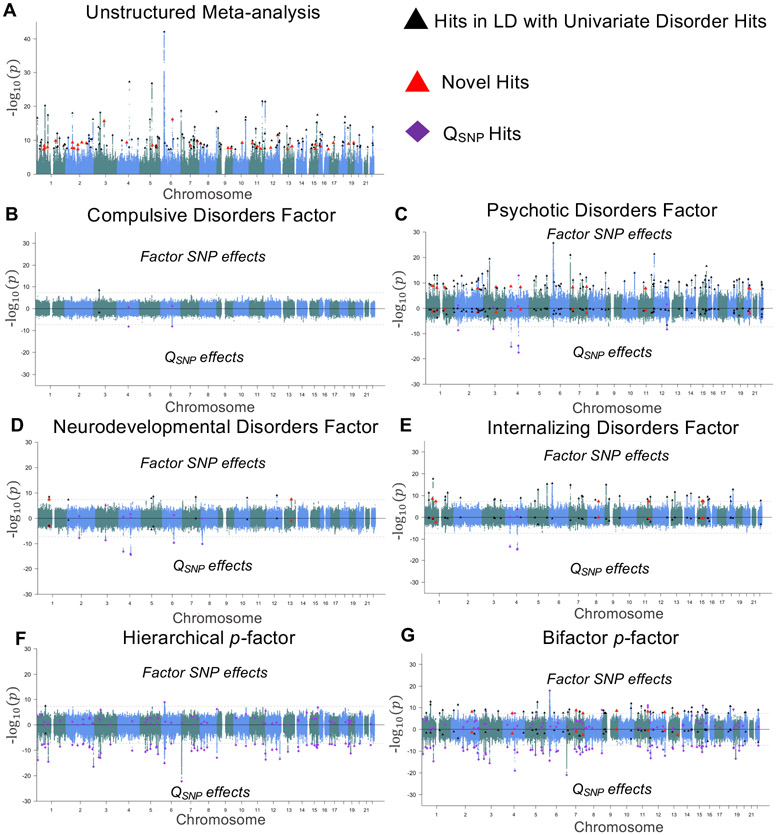
Figure 6 ∣. Miami plots for psychiatric factors.
a, Results from an unstructured meta-analysis of the 11 psychiatric traits. b-e, Results from the correlated factors model for the Compulsive disorders factor (Factor 1; b), Psychotic disorders factor (Factor 2; c), Neurodevelopmental disorders factor (Factor 3; d), and Internalizing disorders factor (Factor 4; e). f, Results of the SNP effect on the second-order p-factor from the hierarchical model. g, Results from a model in which the SNP predicted the p-factor from a bifactor model. The top half of the plots depict the −log10(P) values for SNP effects on the factor; the bottom half depicts the log10(P) values for the factor-specific QSNP effects. As the omnibus meta-analysis does not impose a structure on the patterning of SNP-disorder associations, it does not have a QSNP statistic. The gray dashed line marks the threshold for genome-wide significance (P < 5 × 10⁻⁸). Black triangles denote independent factor hits that were in LD with hits for one of the univariate indicators and were not in LD with factor-specific QSNP hits. Large red triangles denote novel loci that were not in LD with any of the univariate GWAS or factor-specific QSNP hits. Purple diamonds denote QSNP hits.

