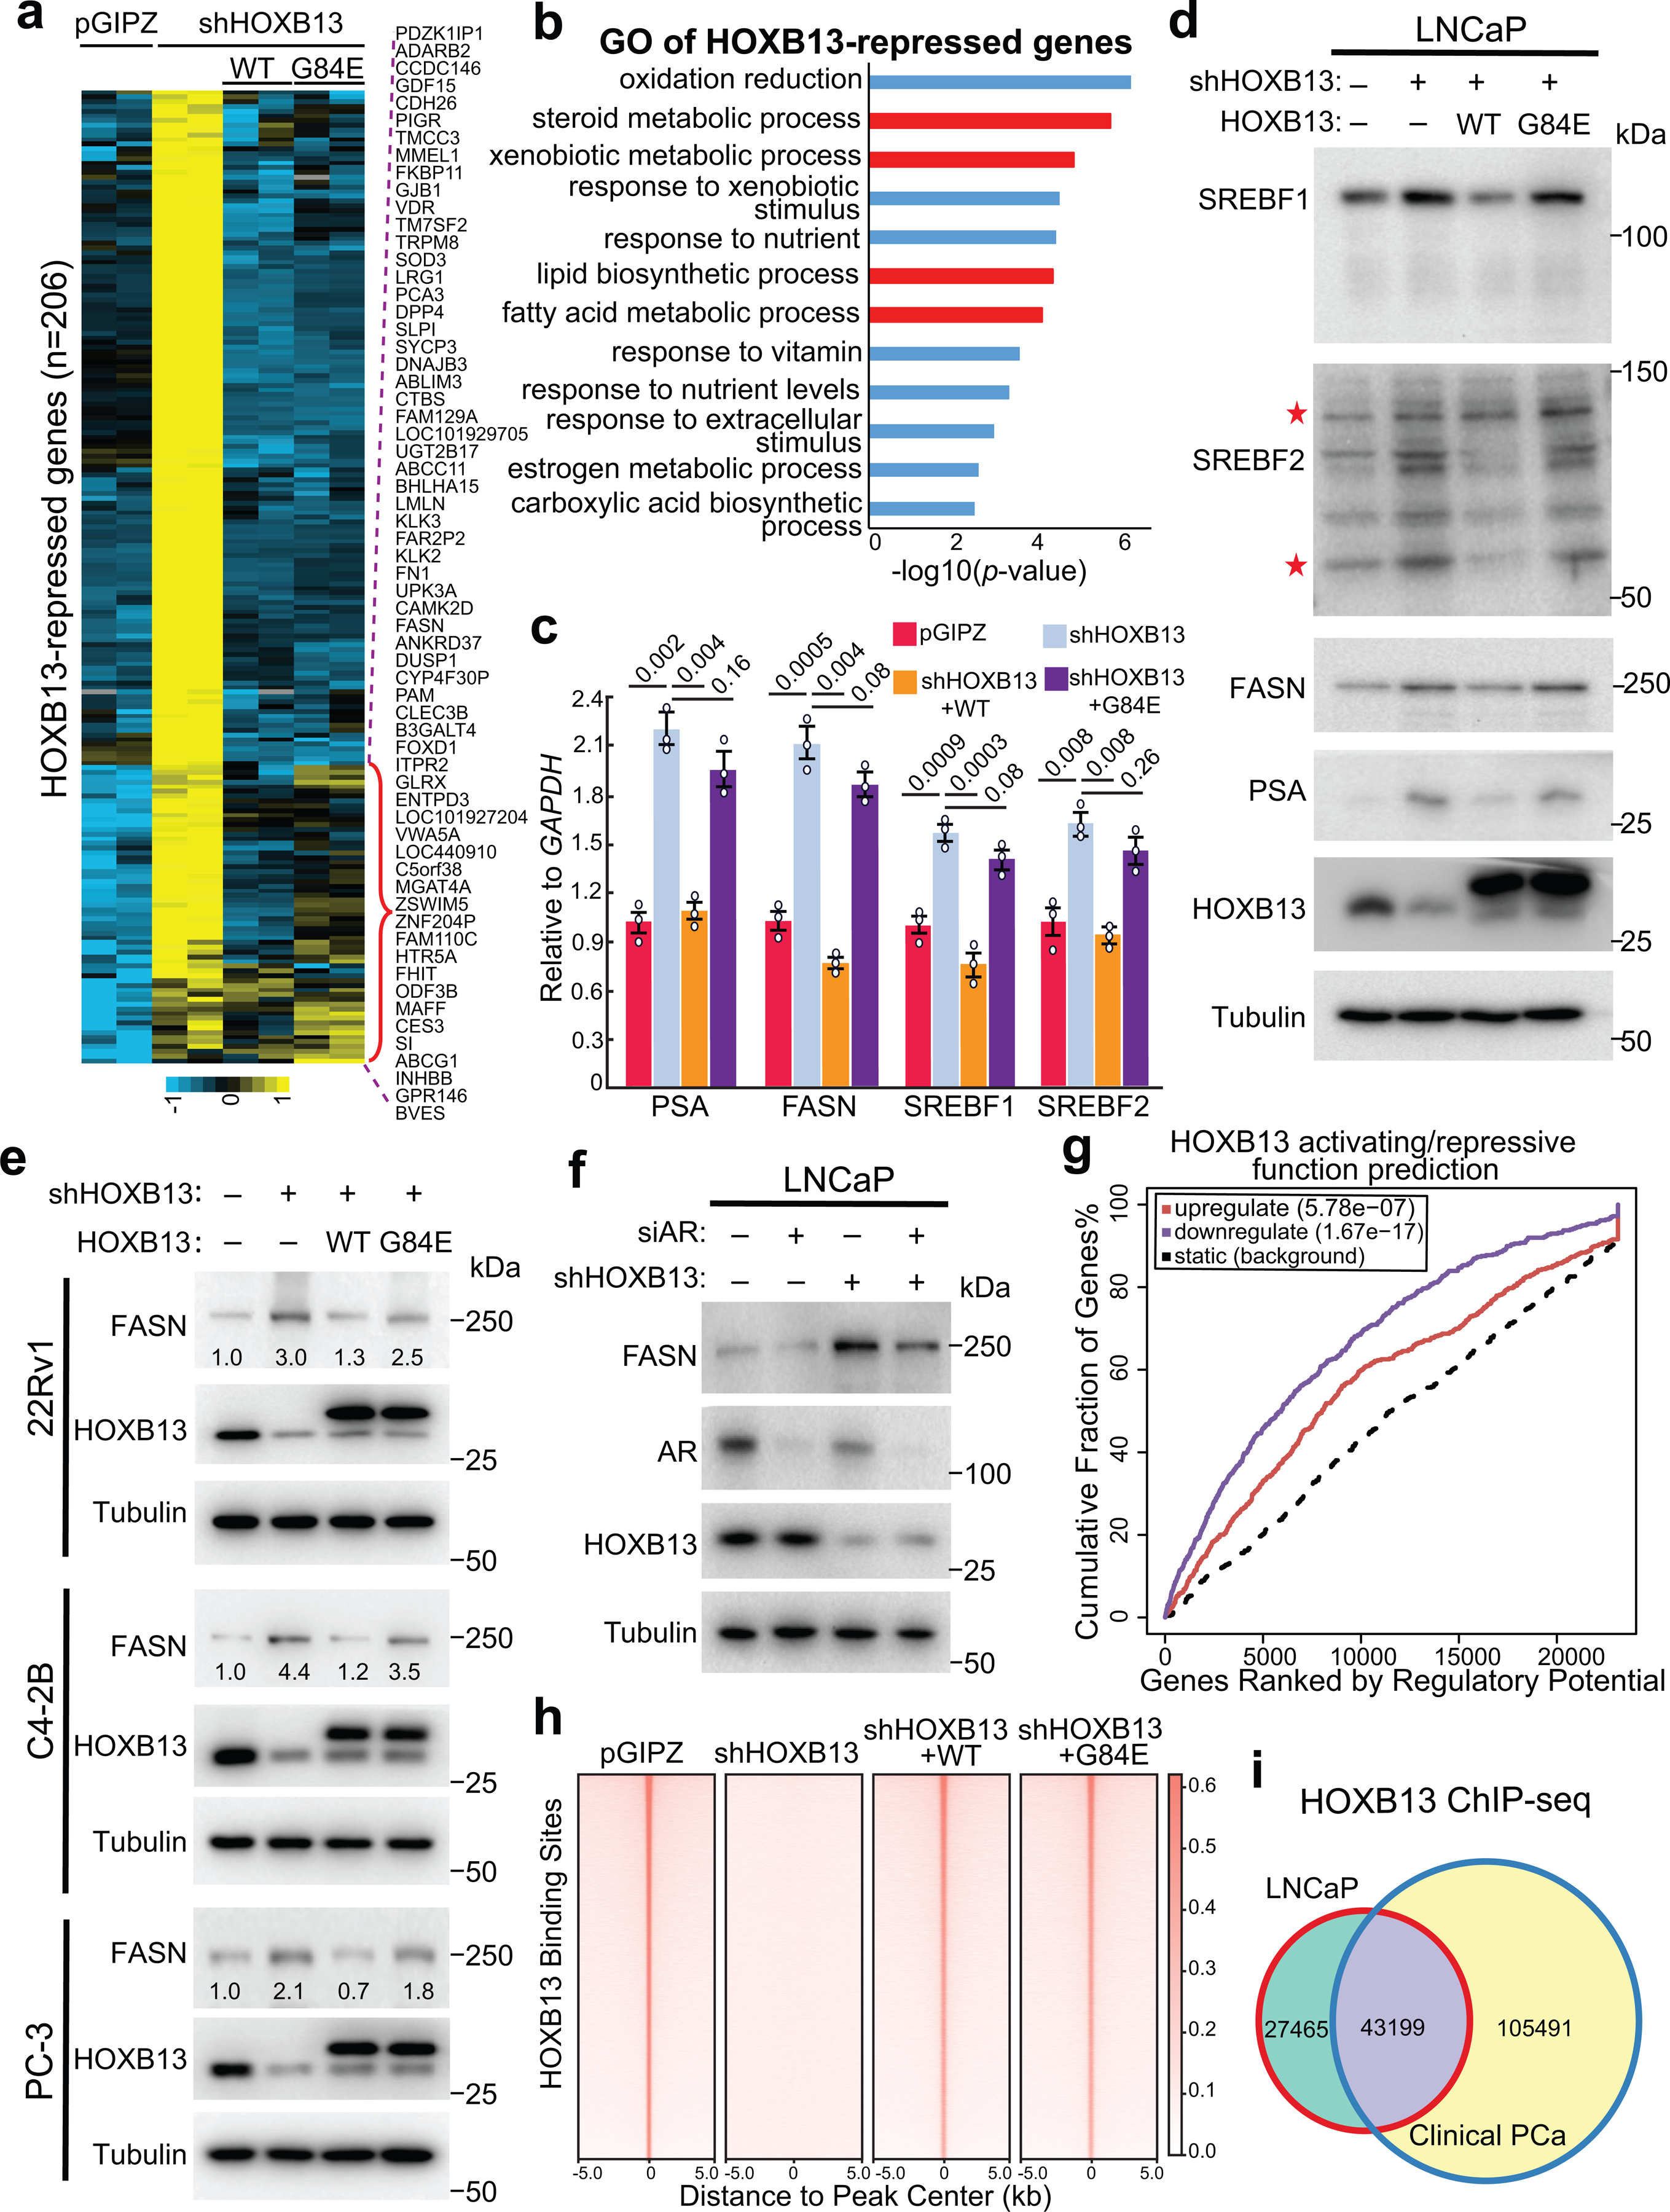
Fig. 1. HOXB13 WT, but not G84E mutant, inhibits lipogenic programs in PCa.

a. Heatmap showing HOXB13-repressed gene expression in PCa cells with HOXB13 KD (shHOXB13) and/or rescue by WT or G84E HOXB13. HOXB13-repressed genes were derived by comparing shHOXB13 with pGIPZ cells using FDR <0.05 and fold-change ≥2.5. The red bracket indicates HOXB13-repressed genes that are rescued by WT, but not G84E, HOXB13. The complete gene lists are included in Supplemental Table 3.
b. GO analysis of HOXB13-repressed genes identified in (a). Top enriched molecular concepts are shown on y-axis, while x-axis indicates enrichment significance. One-sided Fisher’s exact test was performed, and −log10 P values are shown.
c. RT-qPCR validation of key lipogenic gene regulation by HOXB13 in LNCaP cells. Data were normalized to GAPDH and shown as technical replicates from one of three (n = 3) biological replicates. Data shown are mean ±s.e.m. P values by unpaired two-sided t-test.
d. WB of key lipogenic gene regulation by HOXB13 KD and rescue in LNCaP cells. *uncleaved and cleaved forms of SREBF2.
e. WB analysis of FASN regulation by HOXB13 in multiple PCa cell lines with HOXB13 KD and/or WT/G84E rescue.
f. WB analysis of FASN regulation by HOXB13 in LNCaP cells with KD of AR (siAR) and/or HOXB13.
g. HOXB13 ChIP-seq data were integrated with RNA-seq of control and HOXB13-KD LNCaP cells using BETA software to predict activating/repressive functions of HOXB13. Genes are cumulated by rank on the basis of the regulatory potential score from high to low. The dashed line indicates the non-differentially expressed genes as background. The red and purple lines represent the upregulated and downregulated genes, respectively, and their P values were calculated relative to the background group by the Kolmogorov-Smirnov test.
h. Heatmap showing HOXB13 ChIP-seq intensity in HOXB13-KD and rescue LNCaP cells.
i. Venn Diagram comparing HOXB13 cistromes between LNCaP and human PCa tissues.
