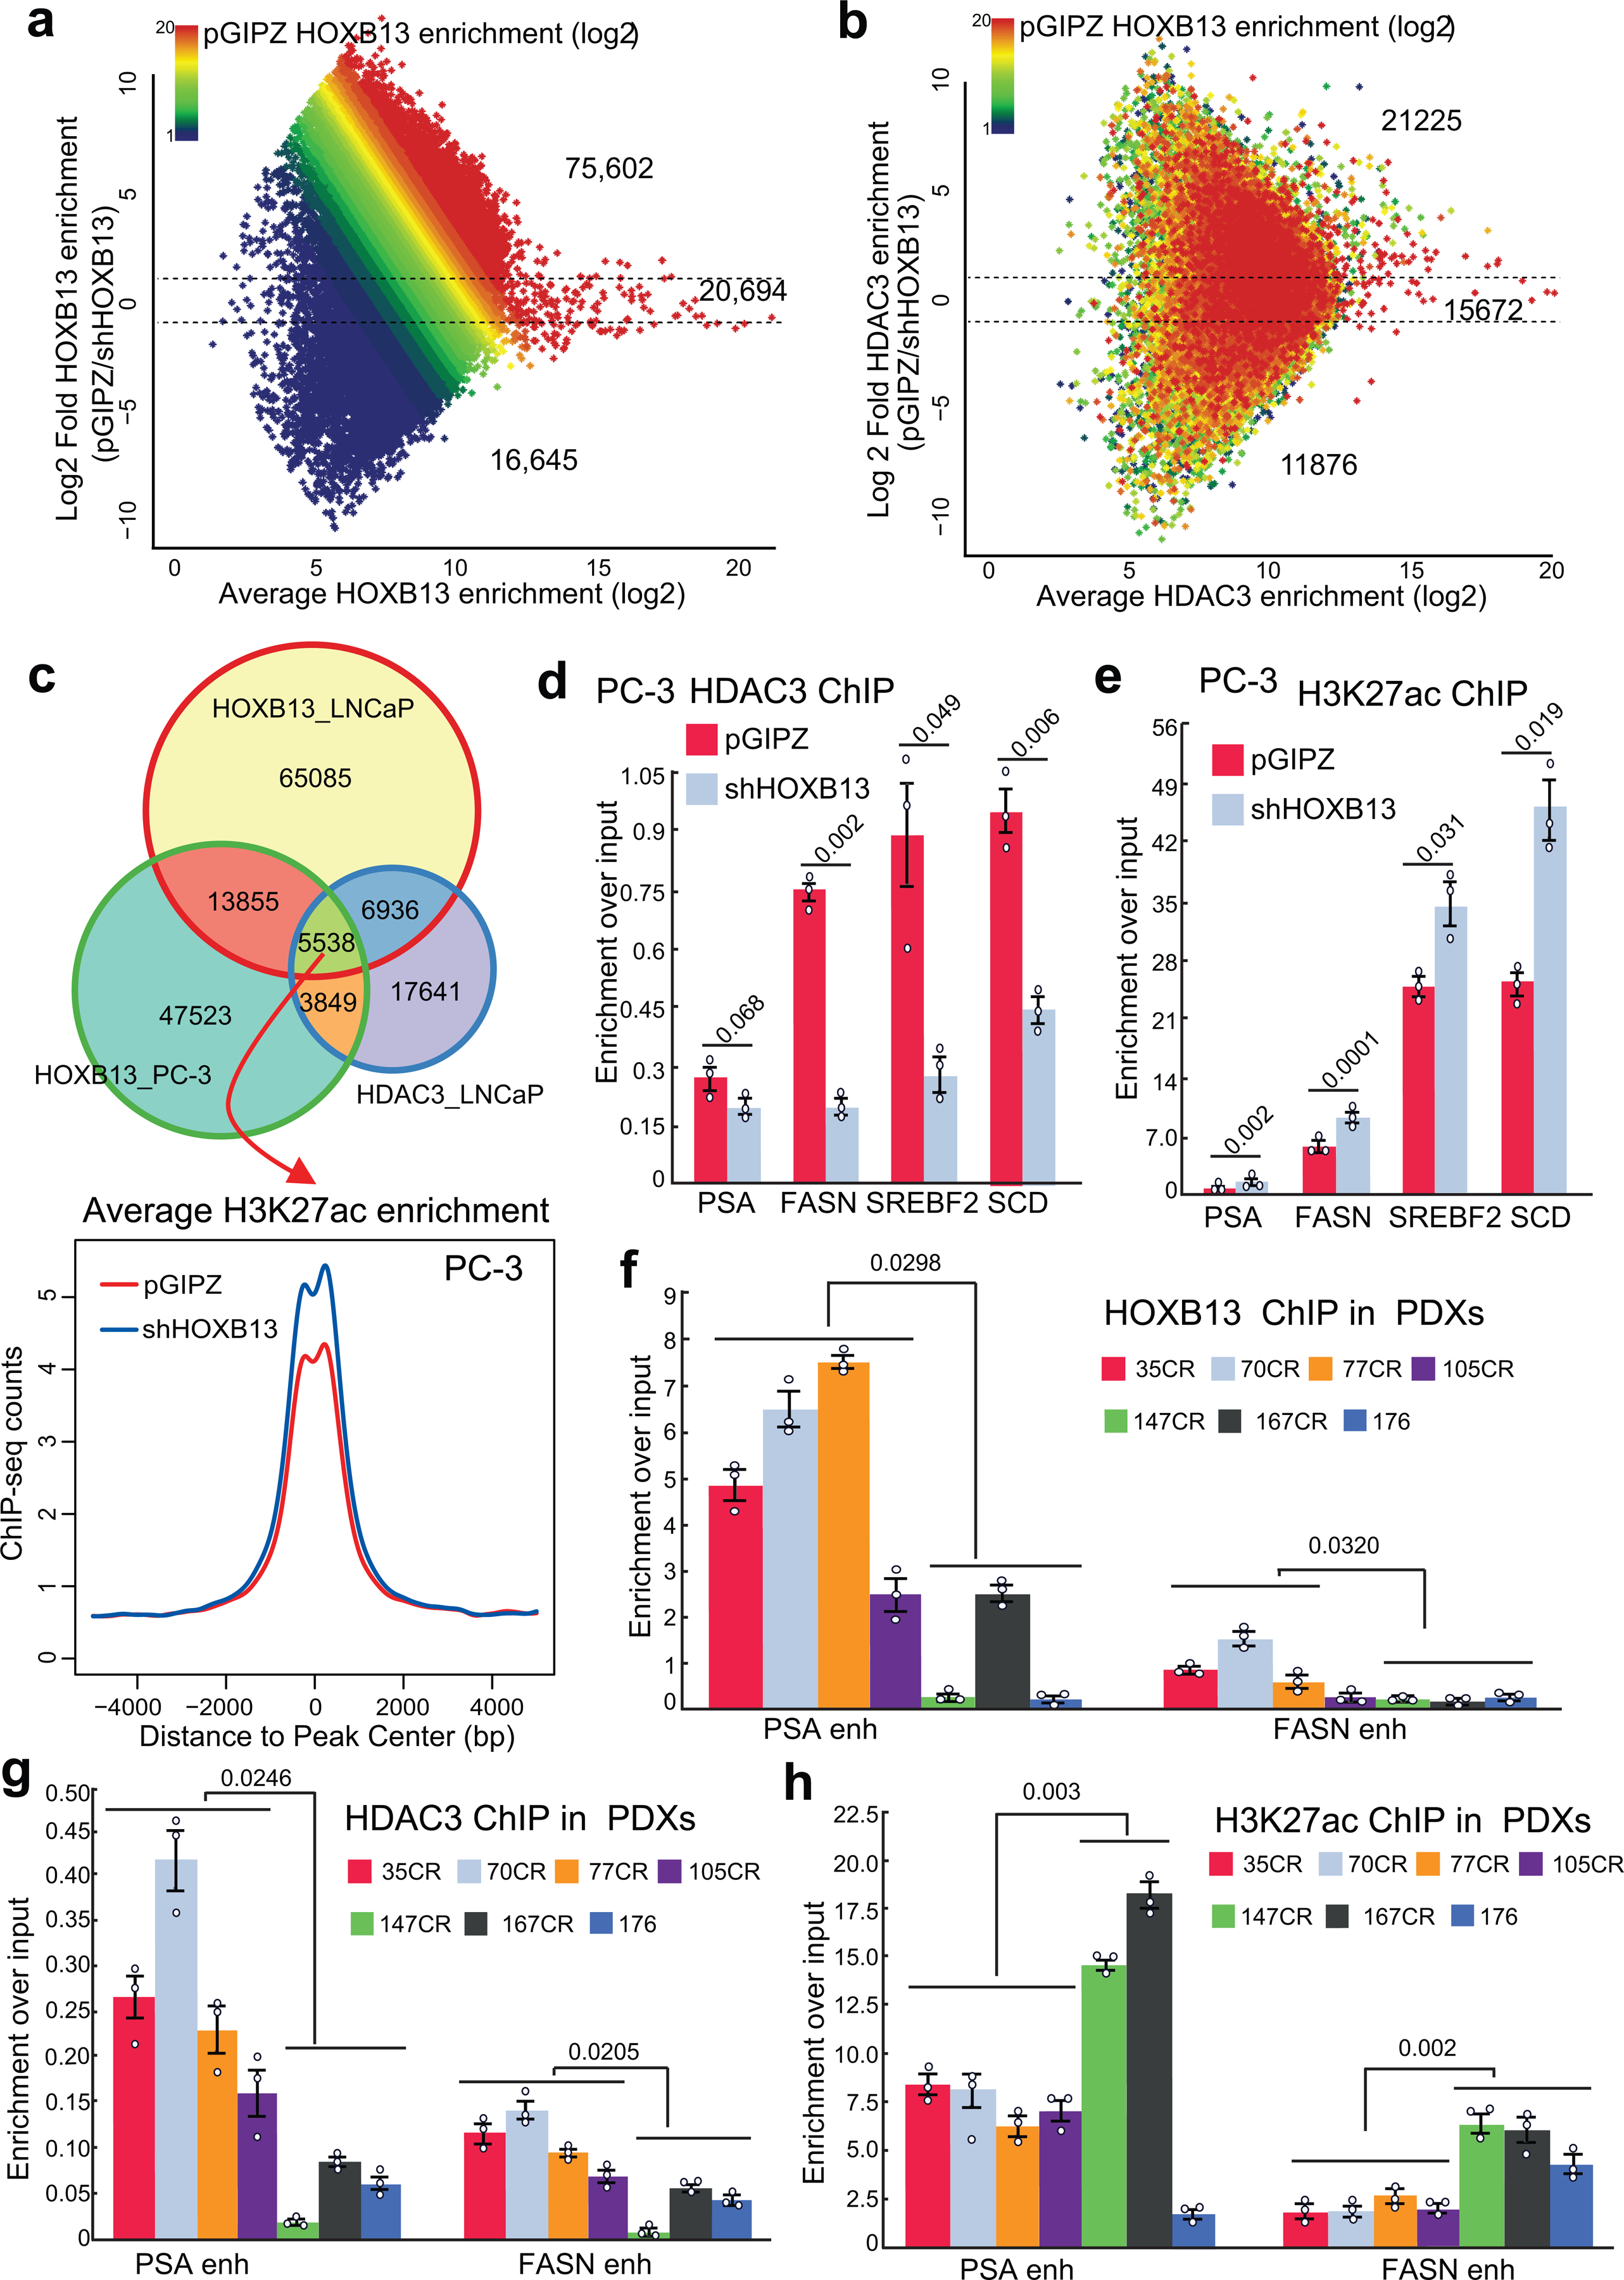
Extended Data Fig. 3. HOXB13 recruits HDAC3 to catalyze histone deacetylation.

a-b. MA plot showing differential HOXB13 (a) and HDAC3 ChIP-seq enrichment (b) in control (pGIPZ) and HOXB13 KD (shHOXB13) LNCaP cells. Color encodes the intensity of HOXB13 ChIP-seq in control cells. Dotted lines represent 2-fold differences.
c. Venn diagram showing the overlap between HDAC3 and HOXB13 cistromes in PC-3 and LNCaP cells (top). Bottom: H3K27ac ChIP-seq was performed in PC-3 cells with control or HOXB13 KD, and their average intensity plots centered (±5 kb) on co-occupied sites are shown.
d-e. ChIP-qPCR analyses of HDAC3 (d) and H3K27ac (e) at lipogenic gene enhancers in PC3 cells with control or HOXB13 KD. Data were normalized to 2% of input DNA. Shown are the mean ±s.e.m of technical replicates from one of three (n=3) independent experiments. P values were calculated by unpaired two-sided t-test.
f-h. ChIP-qPCR analysis of HOXB13 (f), HDAC3 (g), and H3K27ac (h) at PSA and FASN enhancer in 7 CRPC PDX tumors. Data were normalized to 5% of input DNA. Shown are the mean ±s.e.m of technical replicates from one of three (n=3) independent experiments. Unpaired two-sided t-test was performed between indicated groups.
