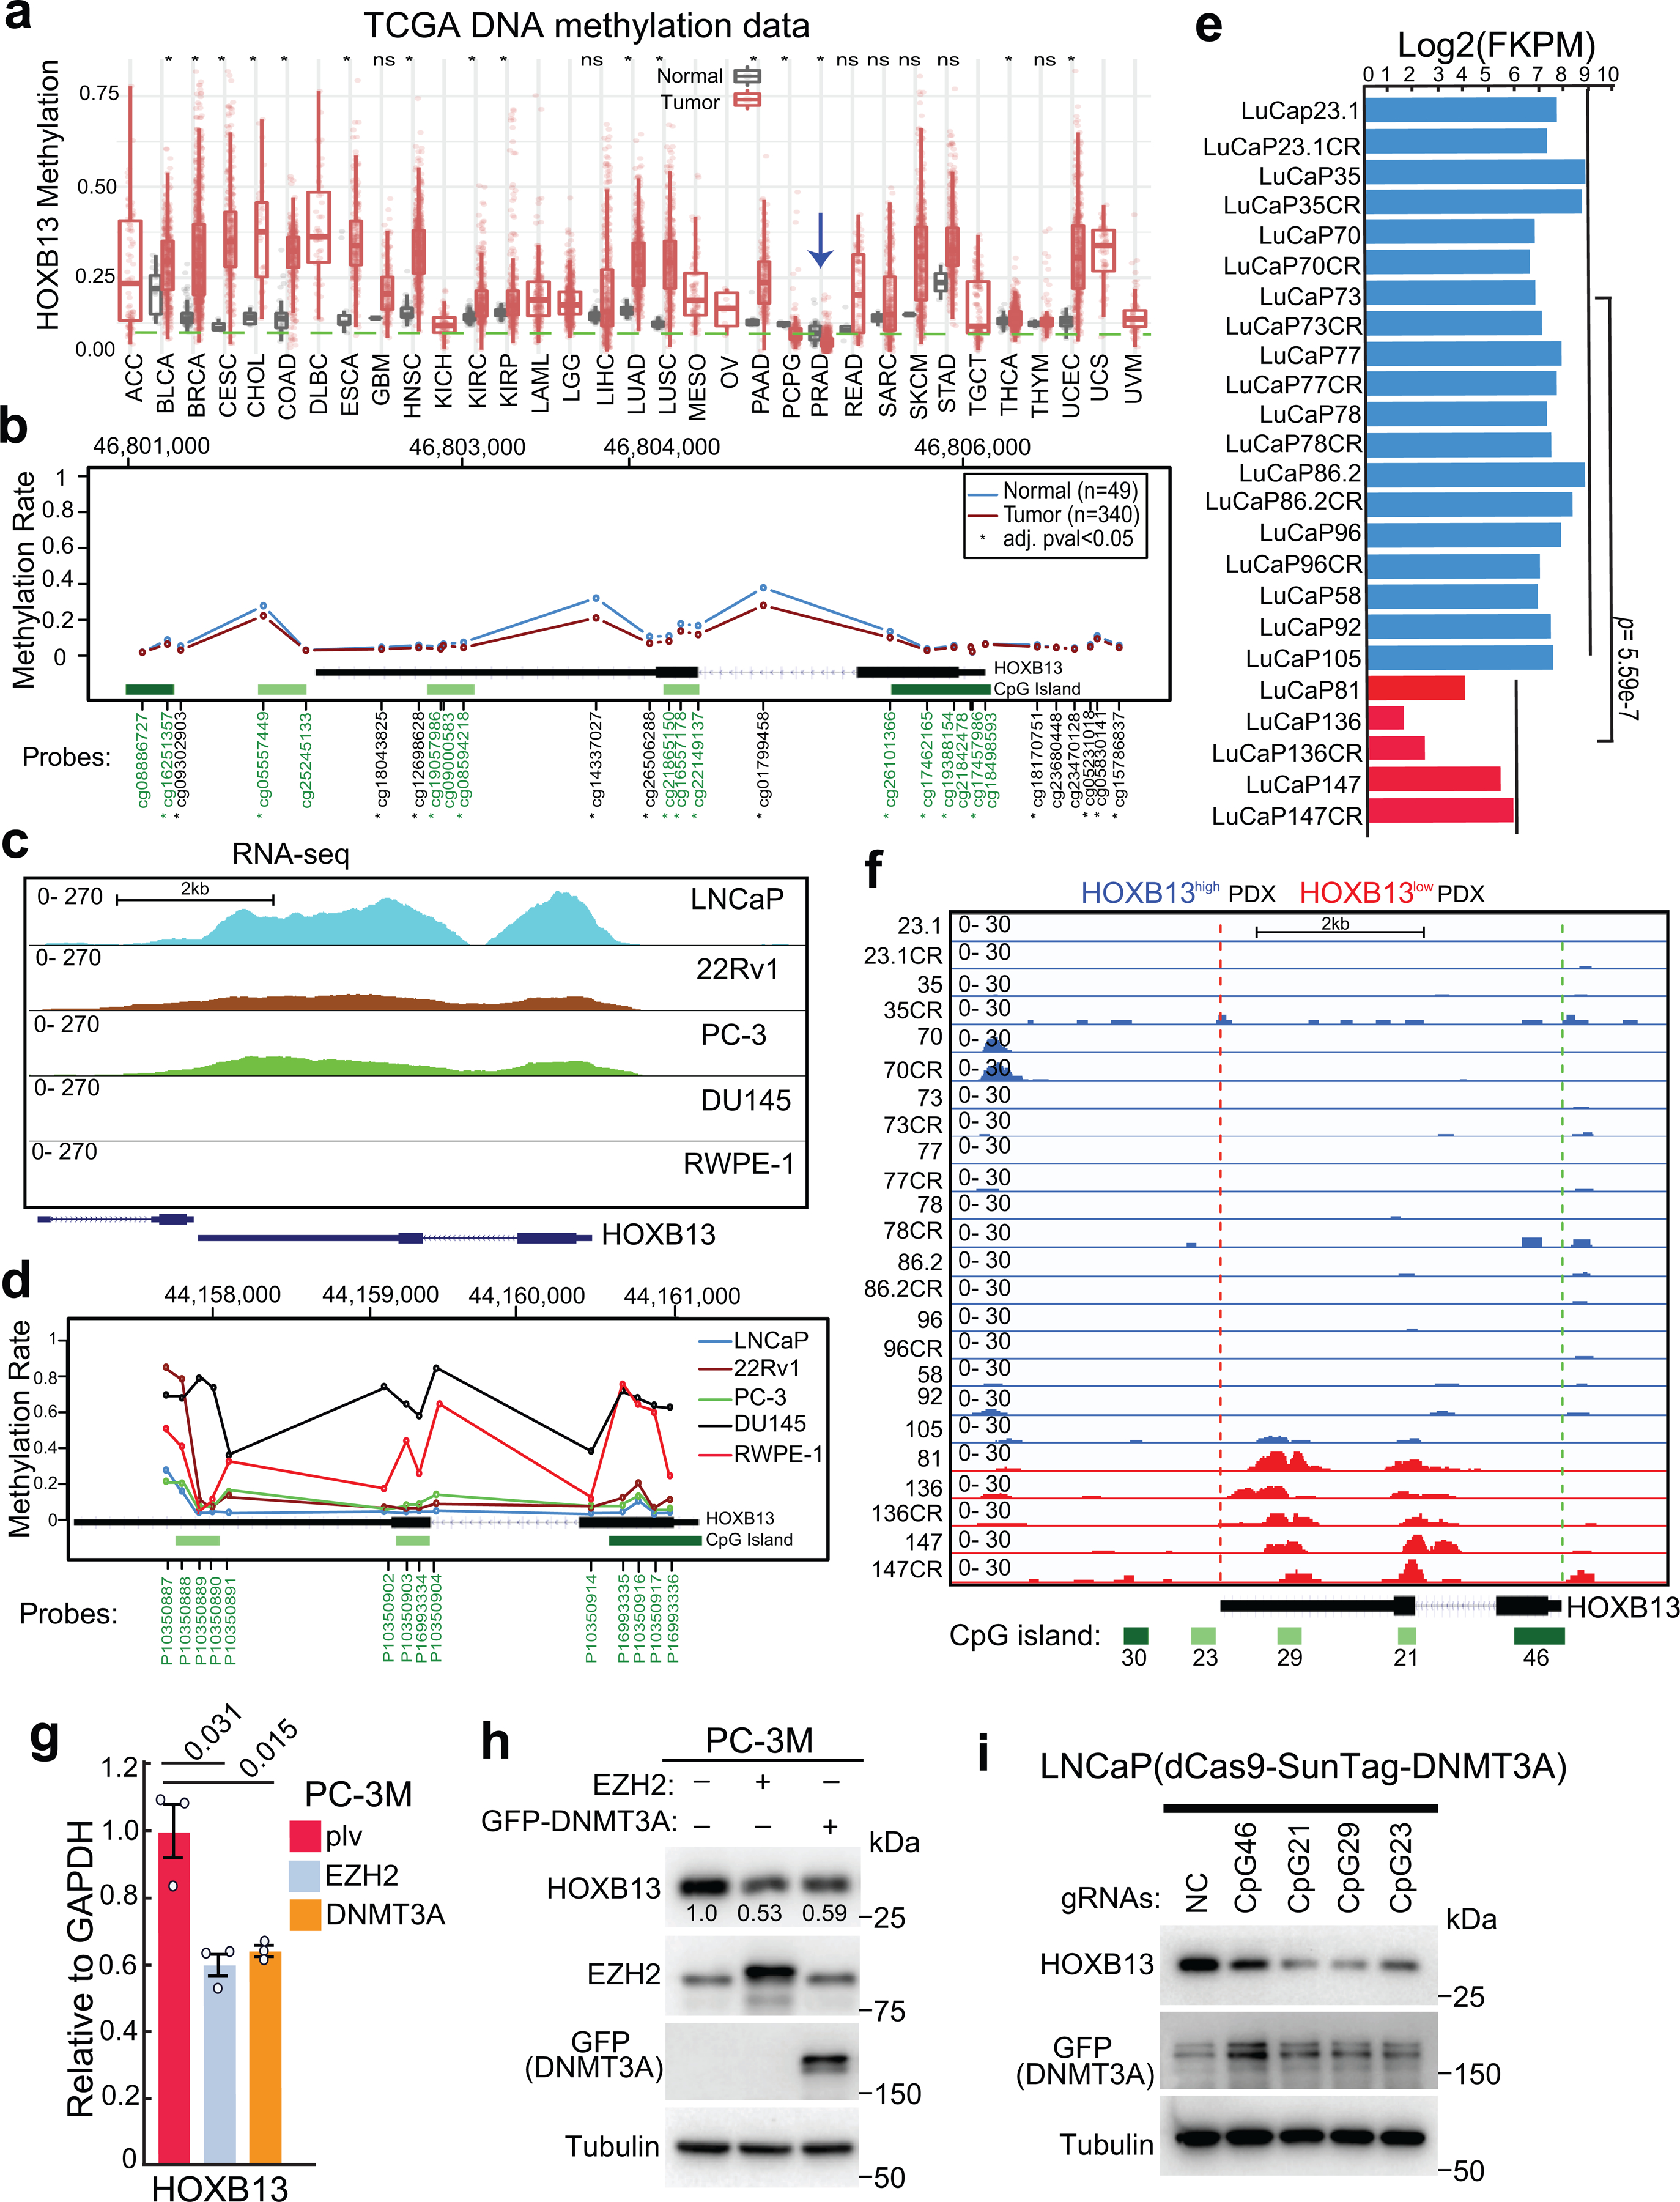
Extended Data Fig. 6. HOXB13 is hypermethylated and down-regulated in CRPC.

a. HOXB13 gene methylation levels in a variety of cancer types and corresponding benign (normal) samples using TCGA methylation data. Blue arrow indicates PCa (PRAD).
*marks tumor types of significant differences compared with matched benign samples by Wilcoxon rank sum test. The sample sizes were included in Supplemental Table 7.
b. Average methylation levels of Illumina Infinium probes targeting different regions of the HOXB13 gene (chr17:46,802,127–46,806,111. hg19) based on TCGA methylation data. Probes in green fonts target CpG islands. *probes with significantly differential methylation between normal and prostate tumor samples (Wilcoxon rank sum test with adjusted p-value < 0.05).
c-d. Genome browser view of RNA-seq data (c) of HOXB13 (chr17:48,724,763–48,728,750, hg38) and average methylation levels (d) of 3 CpG islands within the HOXB13 gene loci (chr17:44,157,125–44,161,110. hg18) in LNCaP, 22Rv1, PC-3, DU145, and RWPE-1 cells.
e. Expression of HOXB13 in Log2(FKPM) in LuCaP PDXs based on RNA-seq data. Blue indicates high- and red for low-HOXB13 samples.
f. IGV track showing methylation at HOXB13 gene (chr17:46,802,127–46,806,111. hg19) in LuCaP PDX tumors with high or low HOXB13 as indicated in e. HOXB13 gene methylation in LuCaP PDX tumors was analyzed using MeDIP-seq data.
g-h. RT-qPCR and WB analyses of PC-3M cells subjected to EZH2 or GFP-DNMT3A overexpression. PCR data shown are mean ±s.e.m. of technical replicates from one of three (n=3) independent experiments and analyzed by unpaired two-sided t-test.
i. WB analyses of LNCaP cells treated with dCas9-SunTag-DNMT3A system with gRNAs targeting the 4 CpGs within the HOXB13 gene loci. The gRNAs were cloned into the pLKO5.sgRNA.EFS.tRFP657 vector and an sgRNA (NC) that had no cognate target in the human genome was used as a negative control. WB was performed 7 days after co-infection of indicated constructs.
