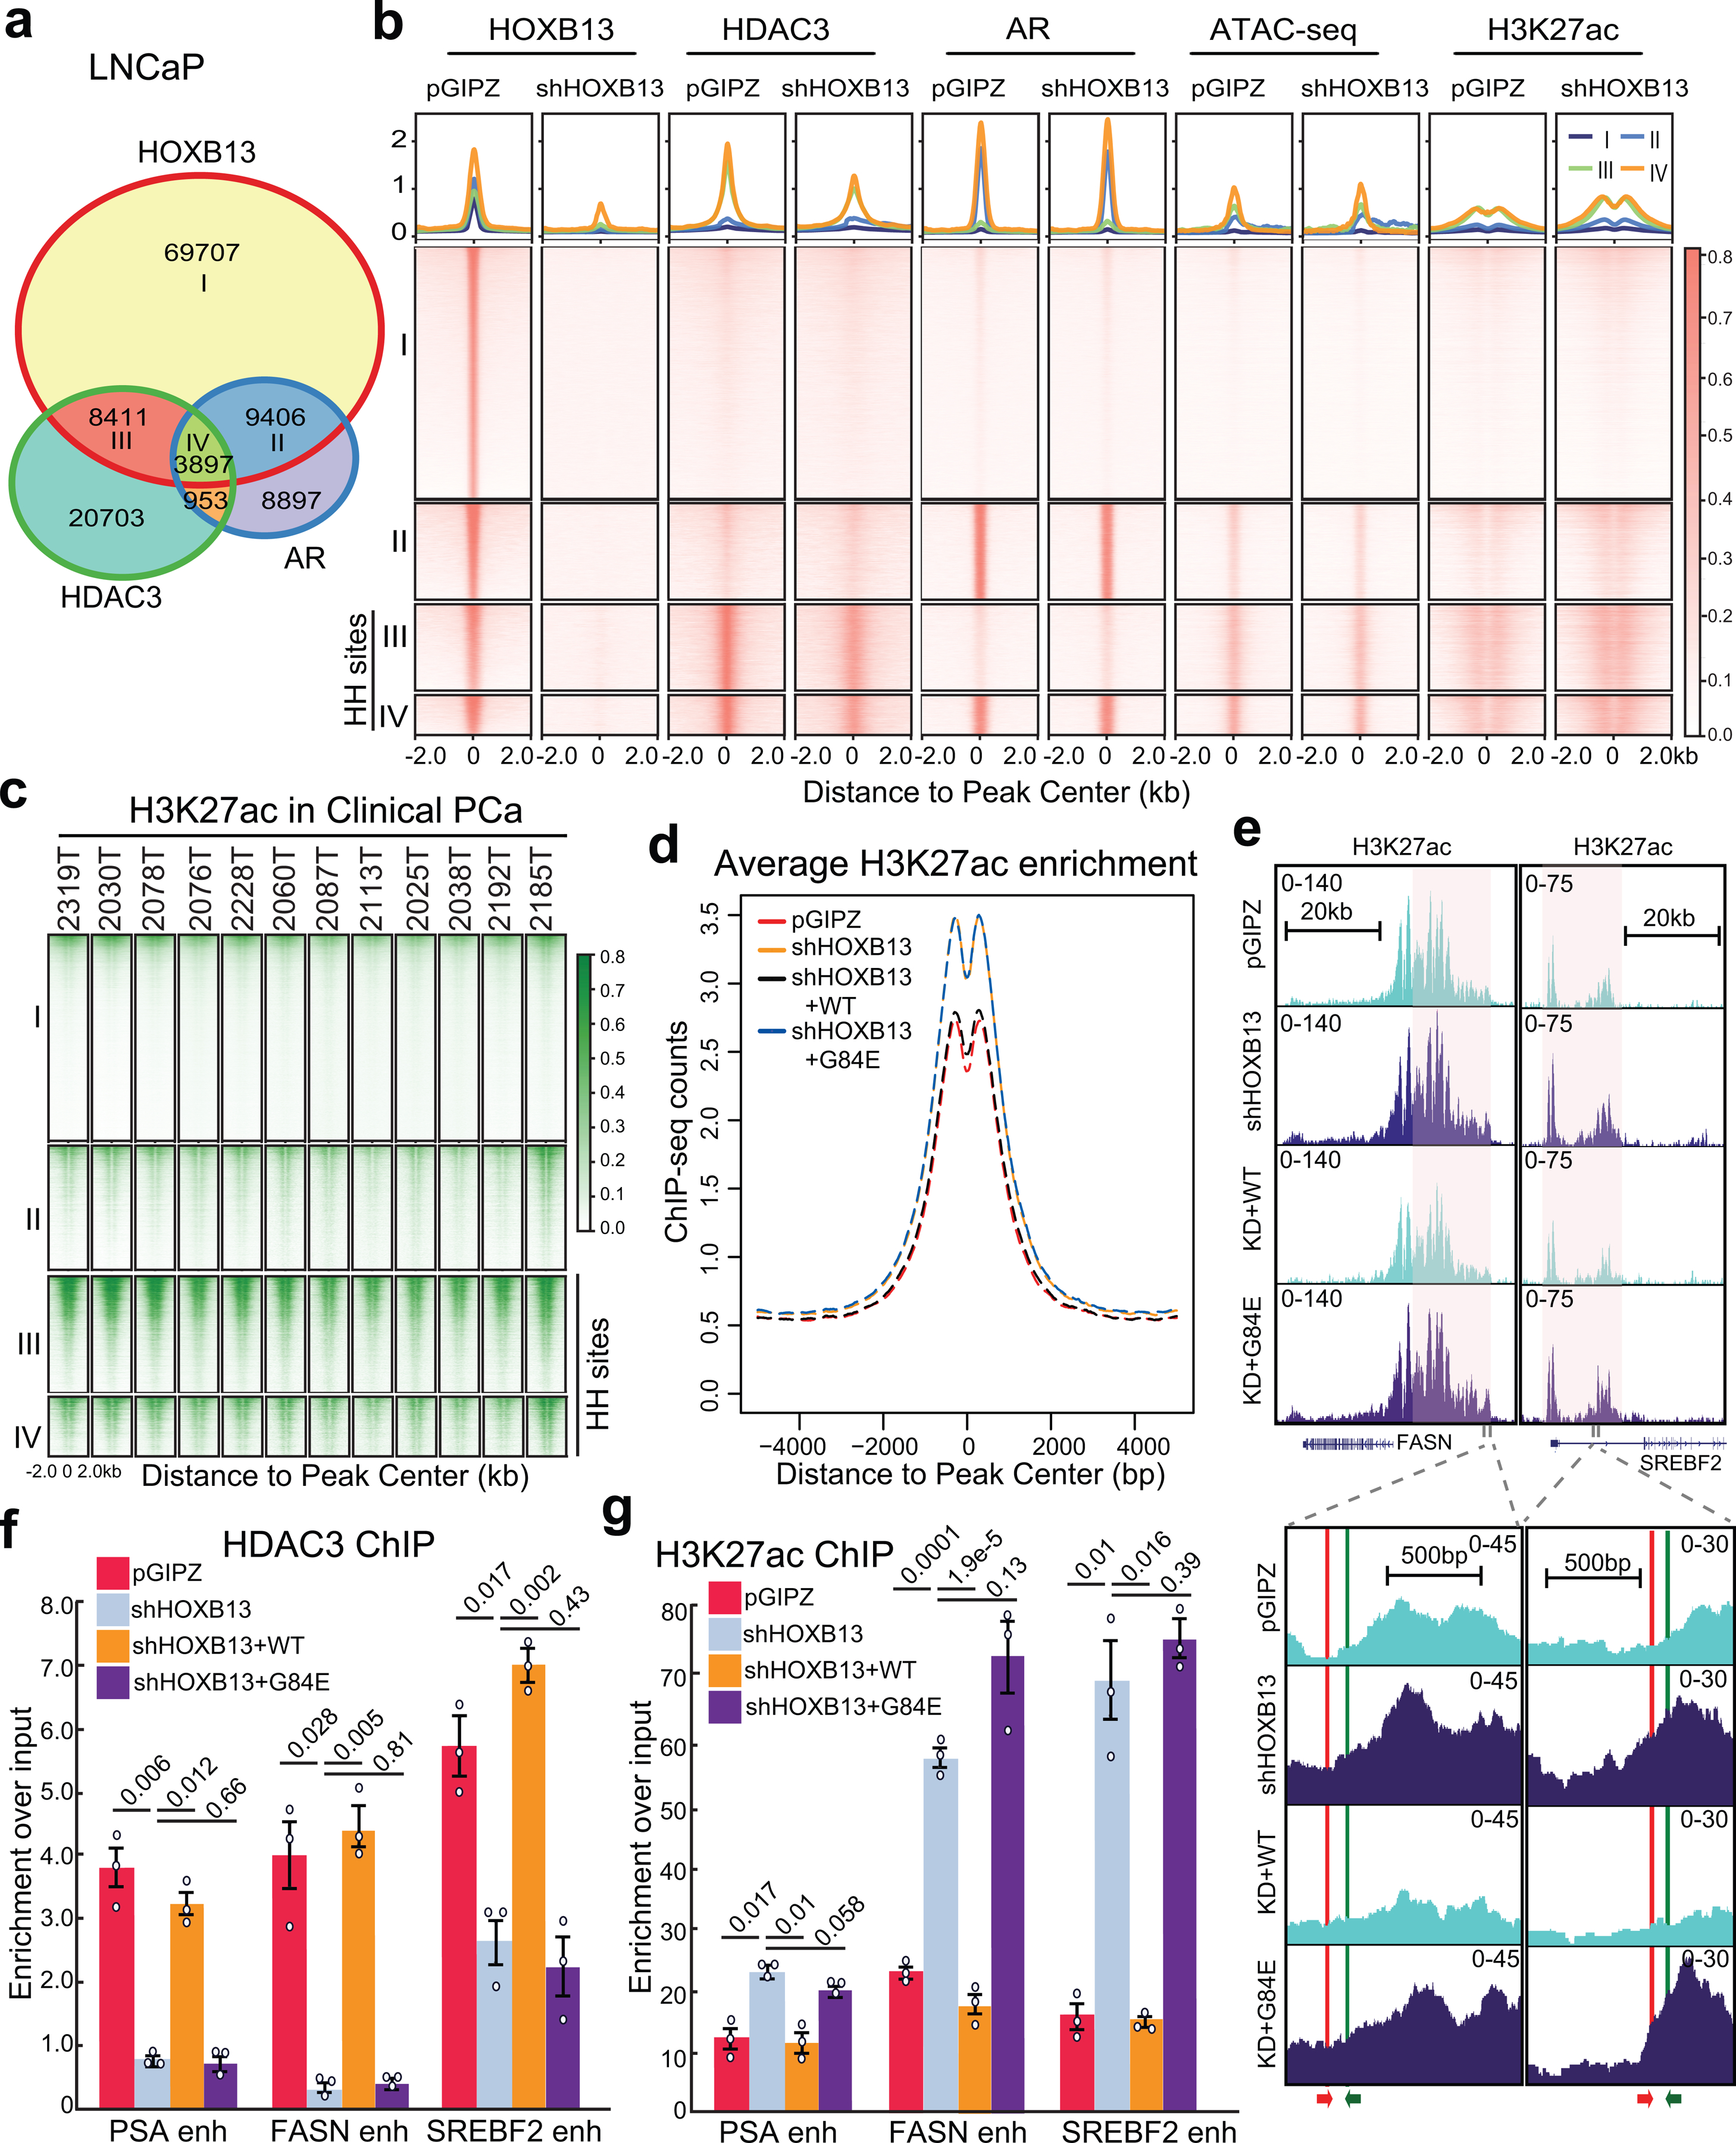
Fig. 3. HOXB13 recruits HDAC3 to catalyze histone deacetylation.

a. Venn diagram showing overlap of HOXB13, AR, and HDAC3 binding sites in LNCaP cells.
b. Heatmap showing signals of HOXB13, HDAC3, AR, and H3K27ac ChIP-seq and ATAC-seq in LNCaP cells with control or HOXB13 KD, centered (± 2 kb) on selected genomic regions defined in a. HH sites: HOXB13/HDAC3 co-occupied sites. The color bar on the right shows the scale of enrichment intensity.
c. Heatmap showing H3K27ac ChIP-seq signal in a set of 12 clinical PCa samples (GSE130408) centered on selected genomic regions as in b.
d. Average H3K27ac signal centered (± 5 kb) on HDAC3 and HOXB13 co-occupied sites (HH sites). H3K27ac ChIP-seq was performed in LNCaP infected with pGIPZ control, shHOXB13 (KD), or KD with co-infection of WT or G84E HOXB13.
e. Genome browser view of H3K27ac ChIP-seq signal around representative lipogenic genes (FASN, chr17:80,036,214–80,056,106 and SREBF2, chr22:42,229,106–42,302,375, hg19). The red and green arrows at the bottom indicate the primers used for the ChIP-qPCR assay.
f-g. HDAC3 (f) and H3K27ac (g) ChIP-qPCR validation of lipogenic gene enhancers (enh) in LNCaP with HOXB13 KD and/or rescue. Primers for FASN and SREBF2 are depicted in e. Data were normalized to 2% of input DNA. Shown are the mean ±s.e.m. of technical replicates from one of three (n = 3) independent experiments. P values were calculated by unpaired two-sided t-test.
