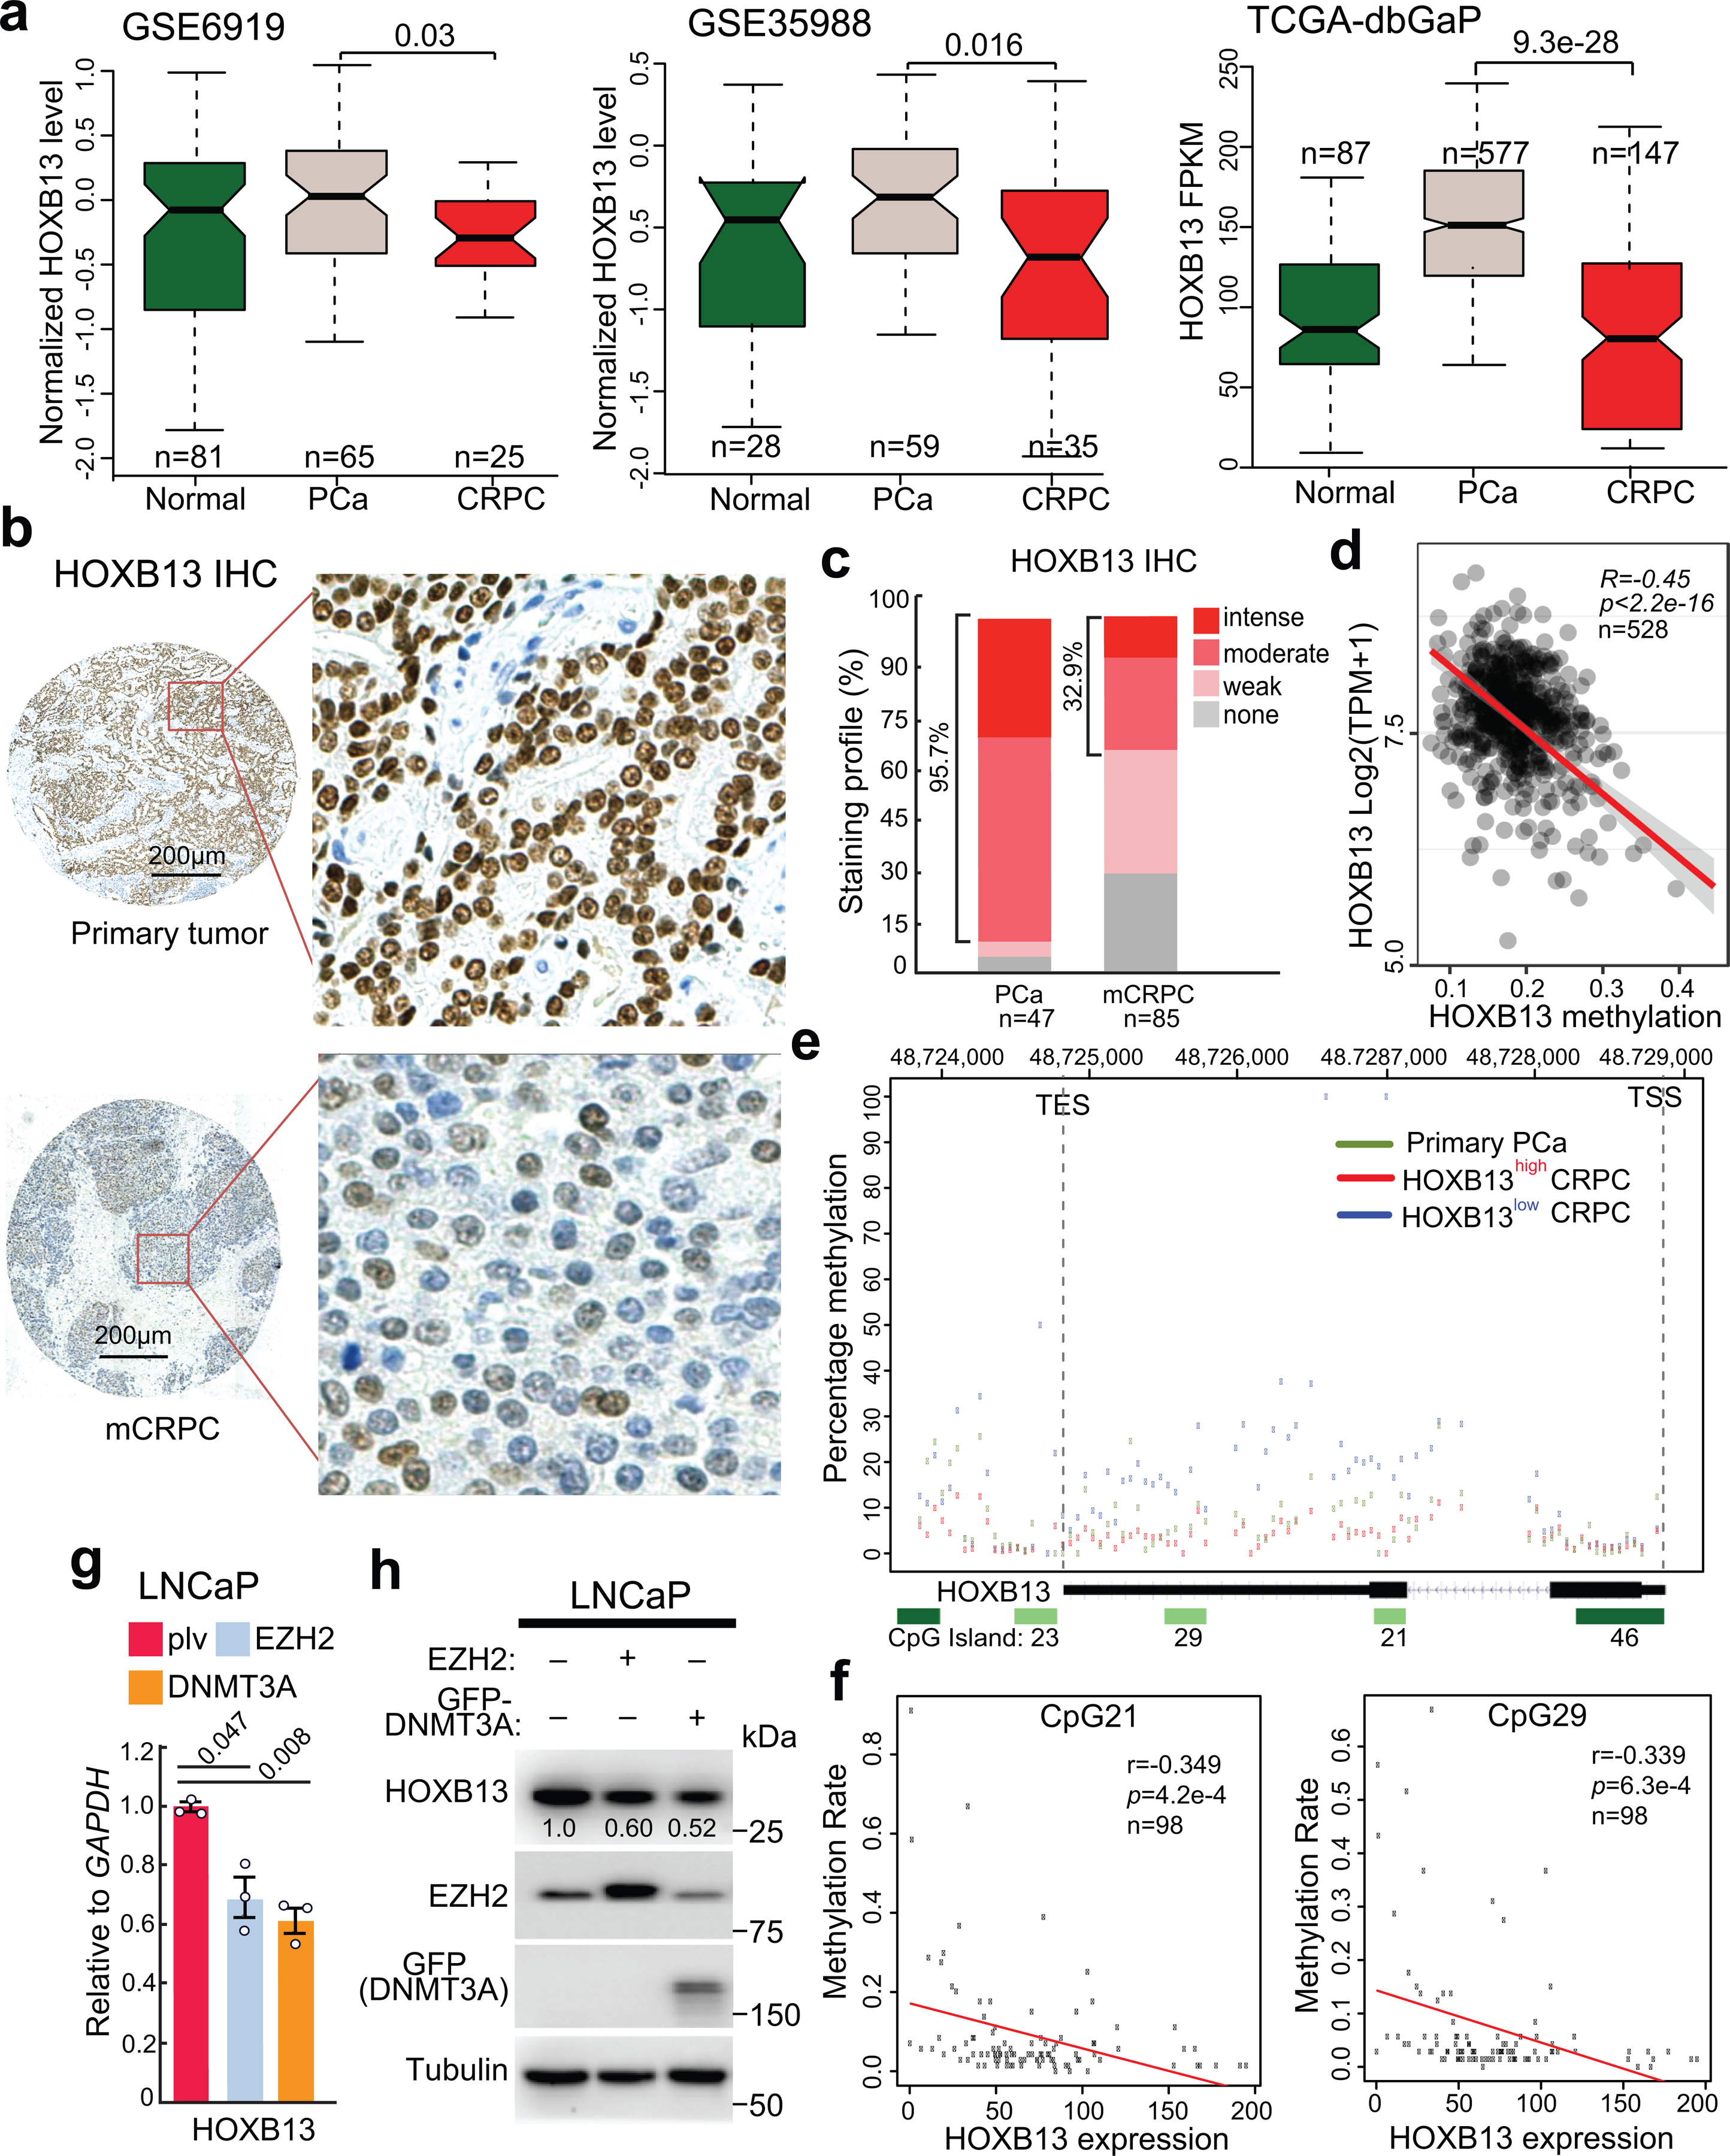
Fig. 5. HOXB13 is hypermethylated and down-regulated in CRPC.

a. HOXB13 expression levels in benign prostate tissues (Normal), primary PCa, and metastatic CRPC in publically available PCa datasets. Data shown (y-axis) are Z-scores of microarray expression values for GSE6919 and GSE35988 and FPKM values for the TCGA-dbGaP dataset, which combines prostate samples from dbGaP datasets with accession#: phs000178(TCGA), phs000443, phs000915, and phs000909. P values between primary and metastatic PCa were calculated using unpaired two-sided t-tests. Boxplots represent the median and bottom and upper quartiles; Whisker edges indicate the minimum and maximum values.
b. Representative images of HOXB13 staining in primary tumors (top panels) and metastatic CRPC (bottom panels) are shown in low- (40×) and high-magnification (200×).
c. Quantification of HOXB13 IHC staining intensities in human PCa and CRPC. y-axis shows the percentage of tumors with none, weak, moderate, and intense IHC staining.
d. Correlation between HOXB13 gene methylation (x-axis) and expression at mRNA level across PCa samples available at TCGA database. The linear regression line (red) with its 95% confidence interval (gray) is shown.
e. Methylation of the HOXB13 gene (chr17:48,724,763–48,728,750. hg38) from the transcription start site (TSS) to transcription termination site (TES) in bottom 18 HOXB13low and top 18 HOXB13high out of all 98 CRPC tumors, relative to five primary PCa. y-axis shows the percentage of methylation.
f. Correlation between methylation rate (0–1) of two CpG islands (named CpG21, CpG29) within the HOXB13 gene, as depicted in Figure 5e, with HOXB13 mRNA levels (FPKM) across all 98 mCRPC samples. Two-sided P values for the T-distribution are shown.
g-h. RT-qPCR and WB analyses of LNCaP cells subjected to EZH2 or GFP-DNMT3A overexpression. Data shown are mean ±s.e.m. of technical replicates from one of three (n = 3) independent experiments and analyzed by unpaired two-sided t-test.
