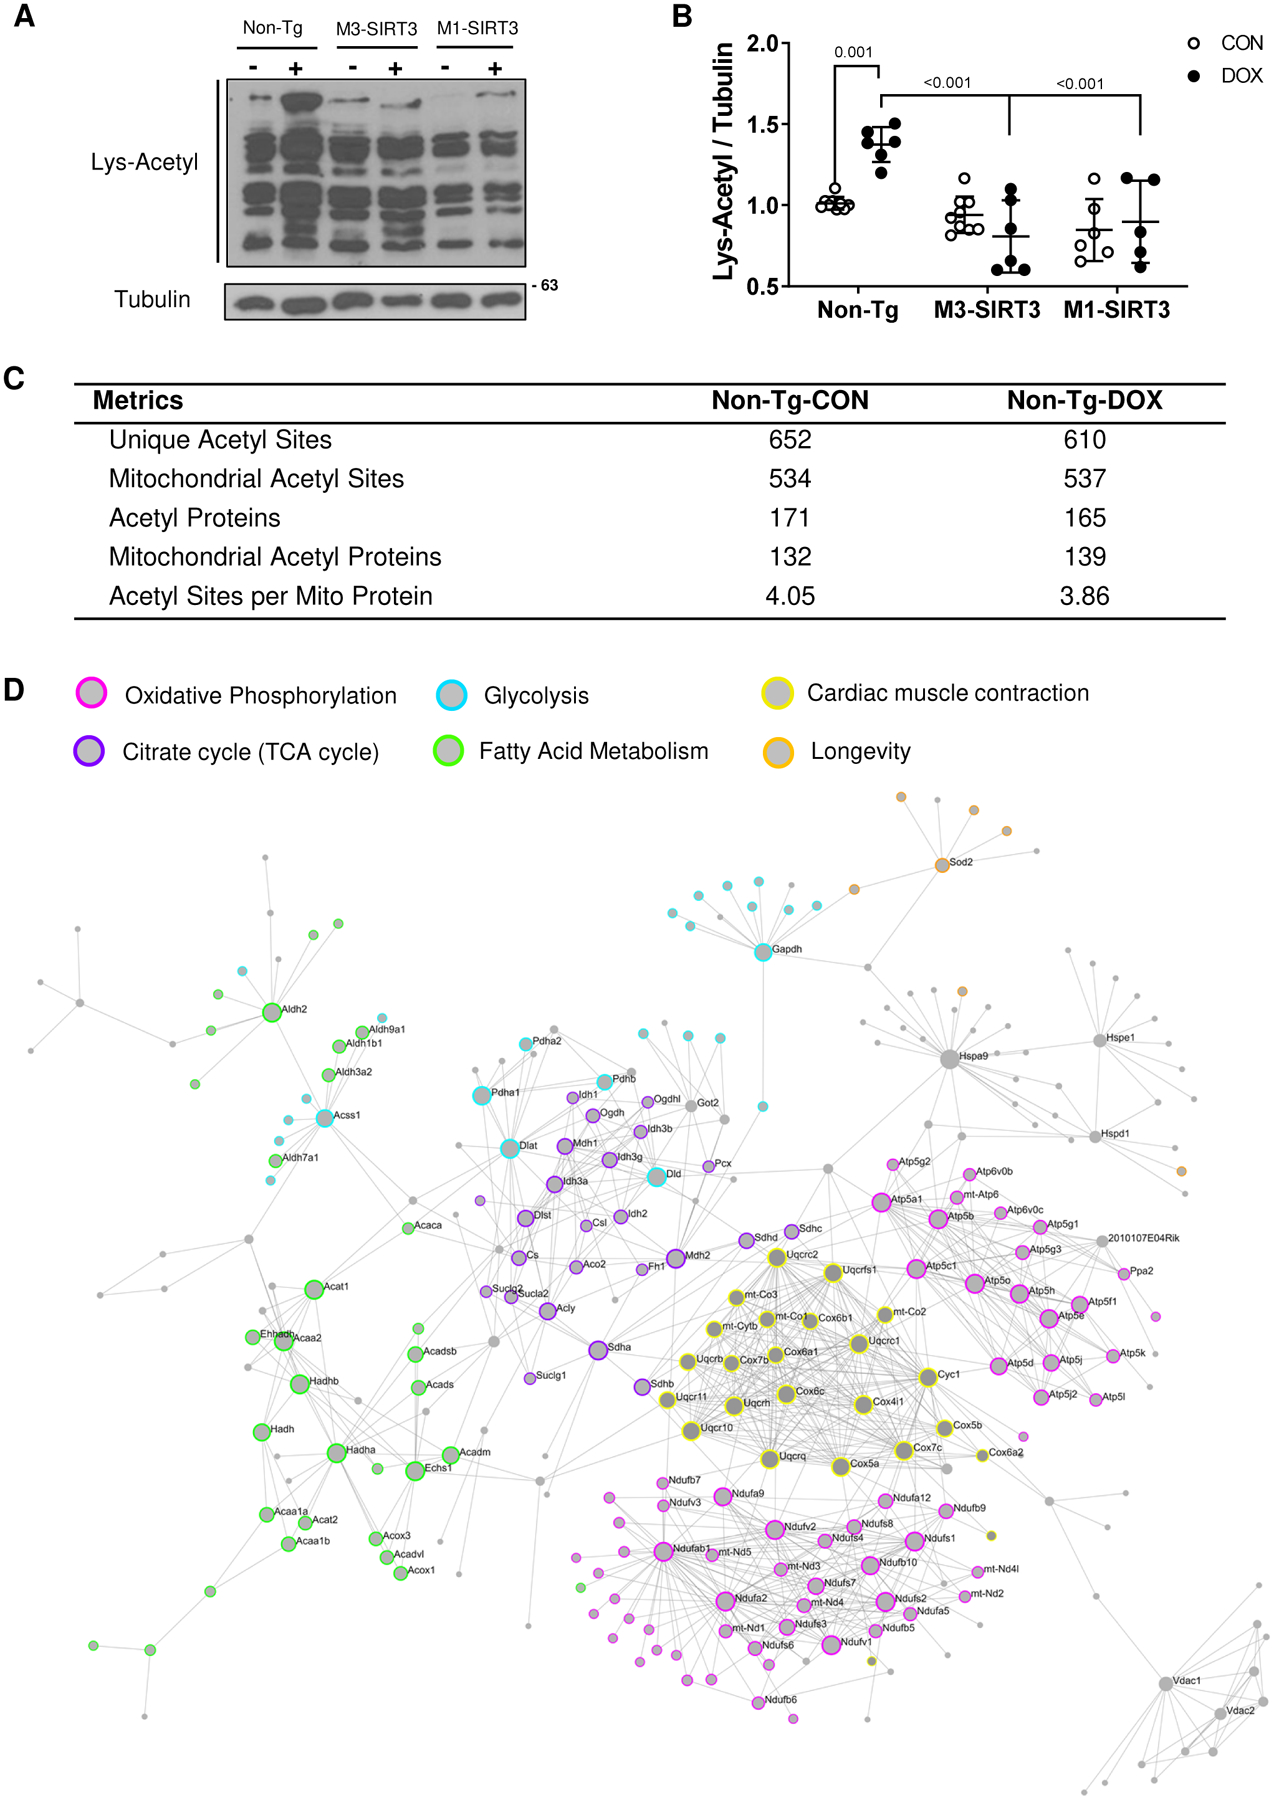
Figure 1. The Cardiac Mitochondrial Acetylome is Involved in Metabolic Processes.

(A) Representative image of acetylated lysine western blot from total cardiac lysates. (B) Optical density quantification of Lys-Acetyl blot relative to tubulin (n=6–10, females) (C) Acetyl-proteomic metrics for saline and DOX treated Non-Tg mice (n=6 CON males, n=5 DOX males) (D) First order protein interaction network of mitochondrial cardiac acetylproteome. Identified proteins from both saline and DOX groups were used as seeds to generate the network using Network Analyst 3.0. The STRING Interactome function was used with a 95% confidence score and requiring experimental evidence. Colours used to highlight KEGG pathways of identified proteins in the network. Pink (oxidative phosphorylation), Purple (TCA cycle), Blue (glycolysis), Green (fatty acid metabolism), Yellow (cardiac muscle contraction), Orange (longevity). Sample size refers to biological replicates. Values are mean ± SD. Statistics are two-way ANOVA with Tukey’s post-hoc test.
