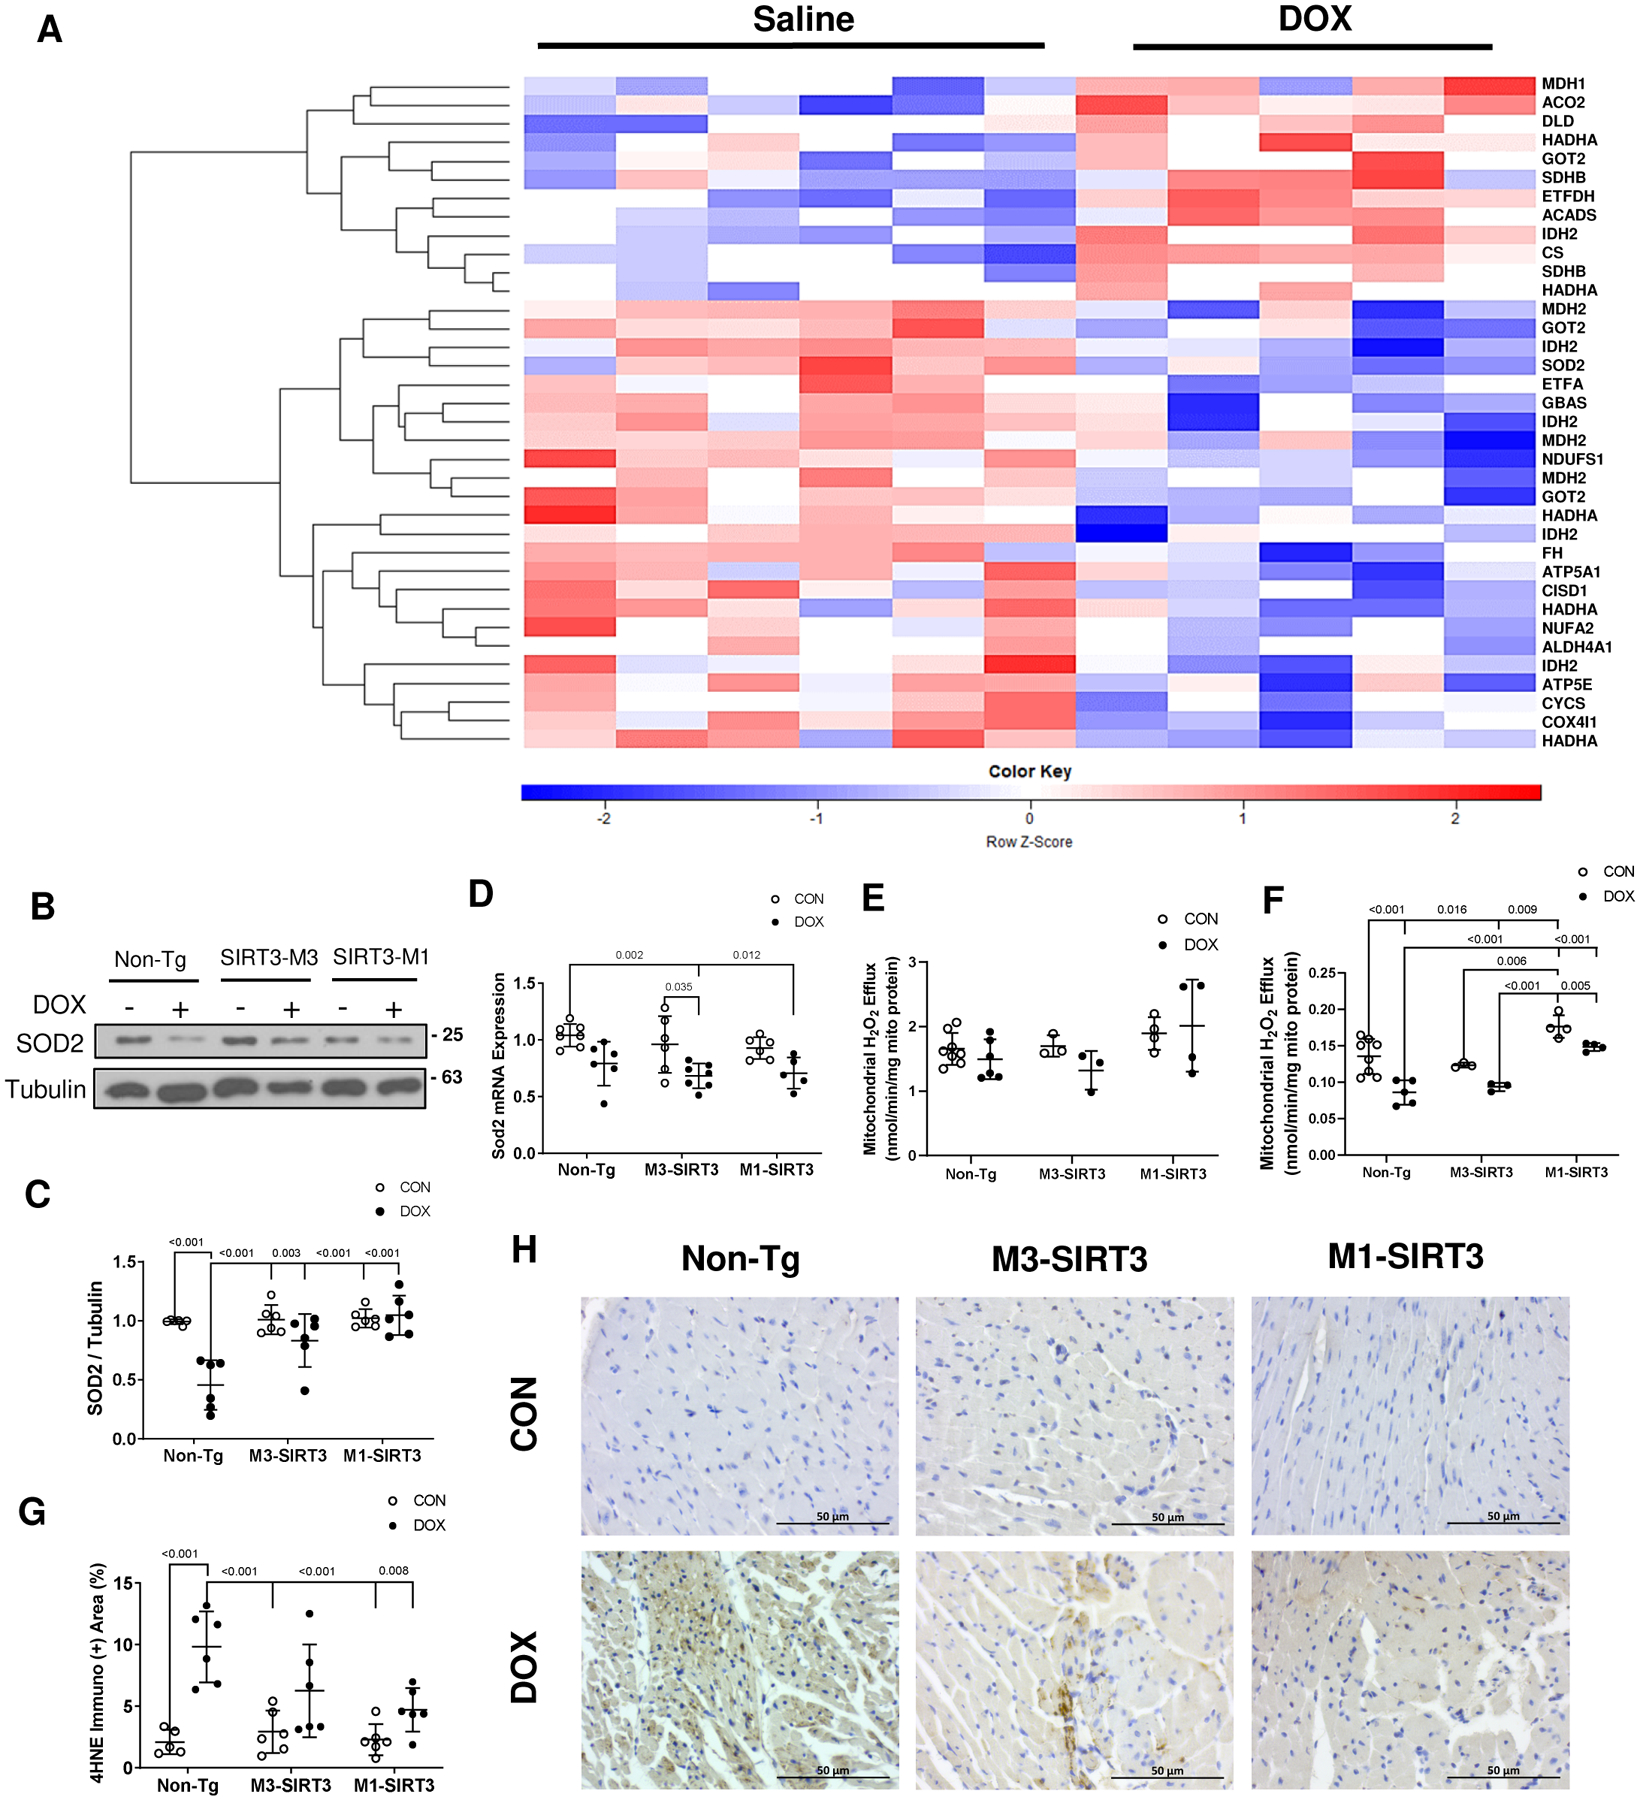
Figure 3. DOX Treatment Alters Acetylation of Cardiac Mitochondrial Peptides Involved in Oxidative Stress in vivo.

(A) Heatmap of acetylated mitochondrial proteins in non-transgenic DOX treated mouse hearts identified by mass spectrometry. Blank cut-off set at 40%. Data represented as scaled log2 value of normalized peak intensity where values have been z-scored. Red indicates hyperacetylated peptide. Blue represents hypoacetylated peptides. Statistics are unpaired student t-test. P<0.05, Non-Tg-CON n=6 (males), Non-Tg-DOX n=5 (males) (B) Representative image of superoxide dismutase 2 (SOD2) western blot from total cardiac lysates. (C) Optical density quantification of SOD2 blot relative to tubulin n=6 (females). (D) SOD2 mRNA expression as measured by qPCR (n=6 females). (E) Mitochondrial hydrogen peroxide (H2O2) efflux after treatment with 5 μM succinate (nmol/min/mg mito protein, n=3–8 females). (F) Mitochondrial H2O2 efflux after treatment with 5 μM succinate and 4 μM rotenone (nmol/min/mg mito protein, n=3–8 females). (G) Area quantification of immuno-positive 4HNE staining (n=4–6 females). Scale bars = 50μm. (H) Representative images of 4-hydroxy-2,3-transnonenal (4HNE) staining. Sample size refers to biological replicates. Values are mean ± SD. Statistics are two-way ANOVA with Tukey’s post-hoc test.
