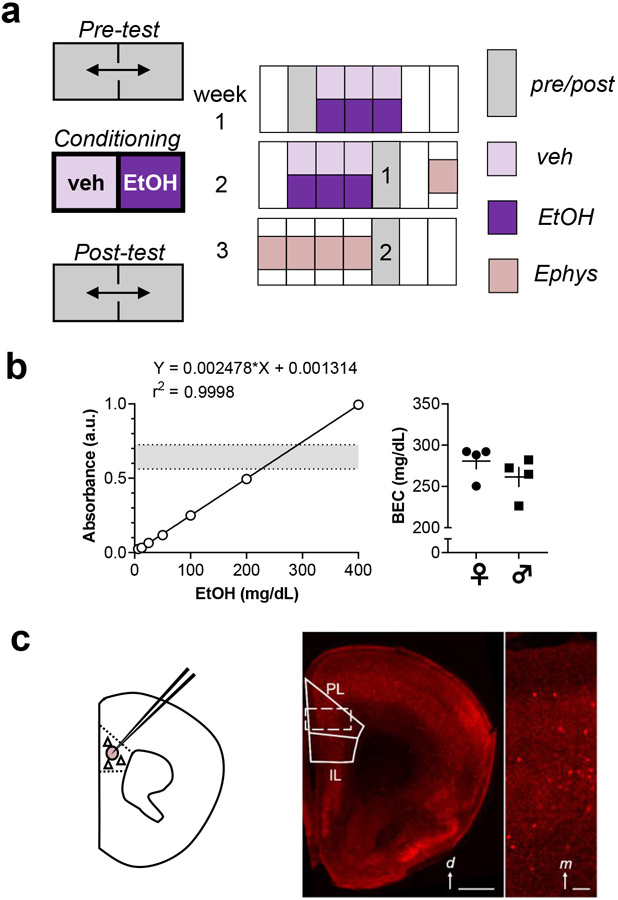
Figure 1. Methodology.
(a) Place conditioning experiments consisted of a 20-minute pre-test; 12, 5-minute saline/ethanol pairings over 6 days; and 2, 20-minute post-tests separated by one week. Animals sacrificed for electrophysiology only underwent the first post-test session. Control mice received a saline vehicle injection before all conditioning sessions. Conditioned place preference (CPP) mice received 2 g/kg ethanol i.p. immediately prior to each 5-minute ethanol conditioning session in the afternoons. Conditioned place aversion (CPA) mice received ethanol immediately after each afternoon conditioning session. (b) Blood ethanol concentrations (BECs) were obtained using an enzymatic colorimetric assay. Left, standard curve displaying high correlation between ethanol concentration and 340-nm absorbance. Dotted lines and shaded area represent the range of values obtained from experimental samples. Right, summarized data displaying intoxication-level BECs obtained from mice 5 minutes after systemic ethanol injection. Female mice (circles) and male mice (squares) displayed comparable BECs (281±10 vs 261±12 mg/dL; t-test: t6 = 1.2, n.s.). N = 4 mice per group. (c) In some studies, acute brain slices were prepared for whole-cell patch-clamp electrophysiology from mice expressing tdTomato fluorescent protein in interneurons expressing parvalbumin (PV-INs). Left, schematic indicating breeding strategy and recording location in prelimbic (PL) prefrontal cortex (PFC). Right, representative image displaying interspersed tdTomato fluorescence throughout neocortex. d, dorsal; IL, infralimbic Scale bar 1 mm. Inset, digital zoom displaying fluorescent PV-INs within PL PFC. m, medial. Scale bar 100 μm.

