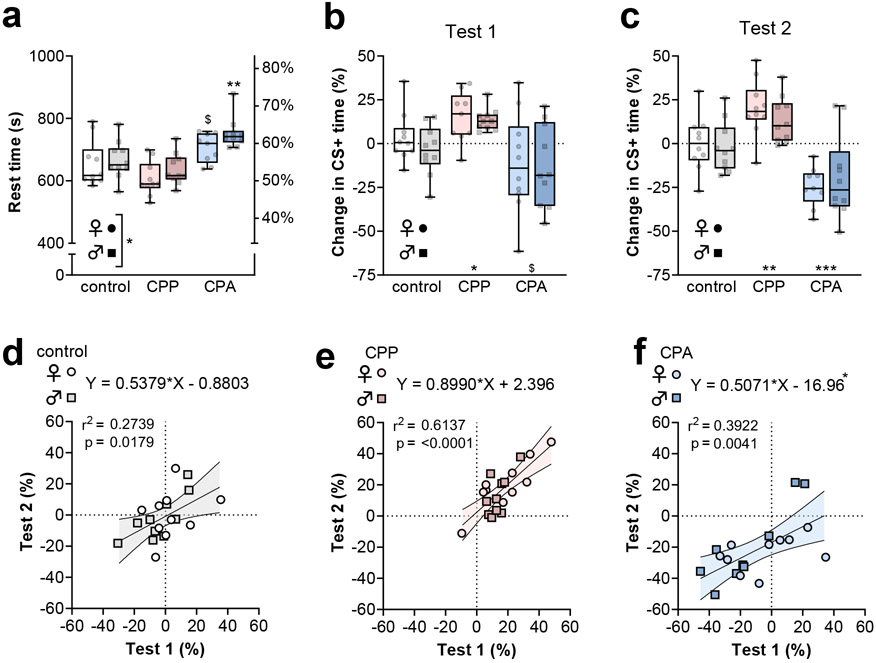
Figure 2. Conditioned place preference (CPP) and conditioned place aversion (CPA) are elicited by ethanol administration.
(a) Time at rest during second post-test. Female mice displayed less time at rest than males (Two-way ANOVA: F1,53 = 4.1, *:p<0.05 main effect of sex). CPA was associated with increased time at rest (Two-way ANOVA: F2,53 = 17.5, p<0.001 main effect of group; $:p<0.1, **:p<0.01, post-test vs same-sex control). (b) Mouse sex did not affect place conditioning during the first post-test (Two-way ANOVA: F1,50 = 0.5, n.s. main effect of sex). CPP mice spent more time on the ethanol-paired (CS+) side, while CPA mice avoided the CS+ side of the test apparatus (Two-way ANOVA: F2,50 = 10.4, p<0.001 main effect of group; *:p<0.05, $:p<0.1 post-test vs mixed-sex control). (c) Mouse sex was not associated with place conditioning during the second post-test (Two-way ANOVA: F1,53 = 0.1, n.s. main effect of sex). CPP mice spent more time on the CS+ side and CPA mice avoided that side of the test apparatus (Two-way ANOVA: F2,53 = 27.5, p<0.0001 main effect of group, **:p<0.01, ***:p<0.001 post test vs mixed-sex control). In control subjects (d), the CPP group (e), and the CPA group (f), the times spent on the CS+ side during the first and second post-tests were correlated. Comparable slopes of the best-fit lines were observed (ANOVA: F2,53 = 1.2, n.s.), but the y-intercepts of the best-fit lines differed across groups (ANOVA: F2,55 = 13.0, p<0.0001). The 95% confidence interval for the y-intercept for the CPA best-fit line did not contain the origin [−24.9 to −9.0]. N = 9-10 mice per group.

