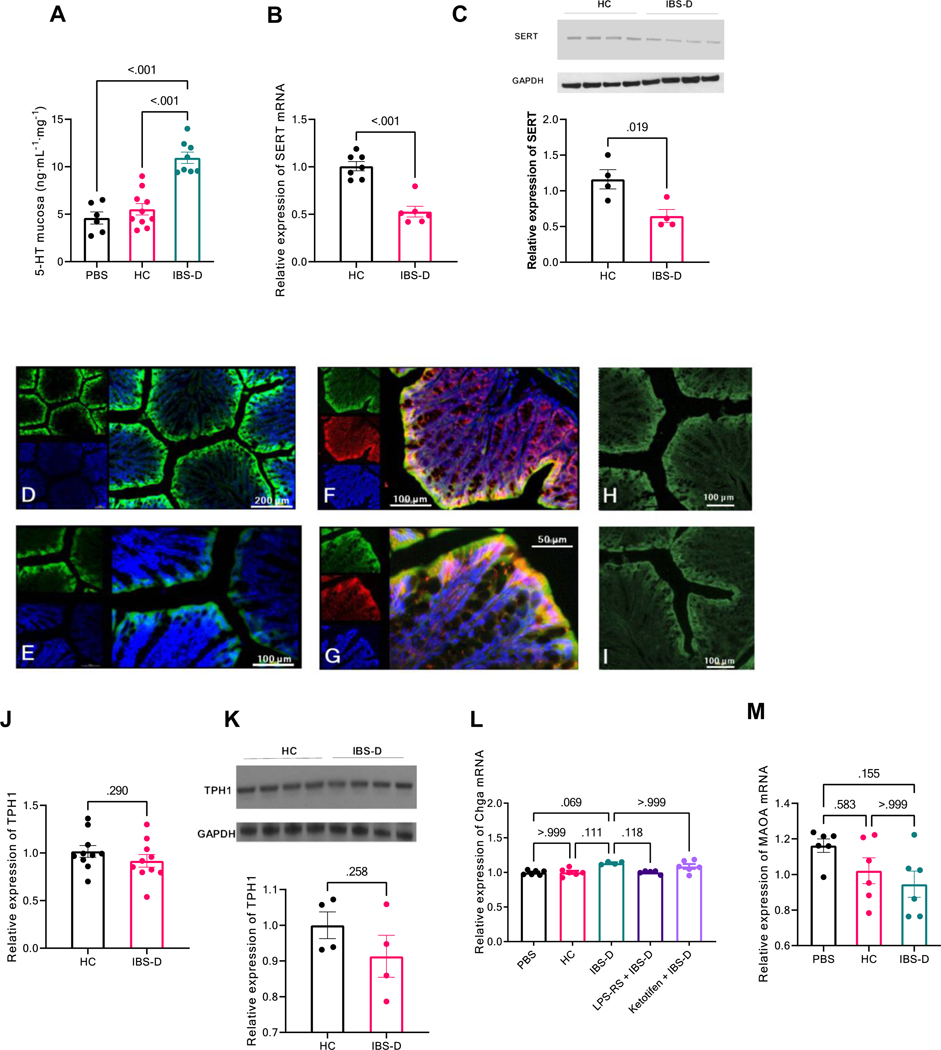
Figure 1. Increased 5-HT level and decreased SERT expression in mouse colon induced by IBS-D patient fecal supernatant.
(A) 5-HT release from distal colonic mucosa in mice 18 h after intracolonic infusion of fecal supernatant (FS) from healthy controls (HC) or IBS-D patients. Results are expressed as mean ± SEM, *P < 0.01 from HC, Student t test, n = 6–9 in each group with duplicated measurements. (B) RT–PCR of SERT in distal colon from mice treated with intracolonic infusion of HC or IBS-D FS. Results are expressed as mean ± SEM, *P < 0.01 from HC, Student t test, n = 6–7 in each group. (C) Western blot of SERT in distal colon from mice treated with HC or IBS-D FS, quantified by densitometry analysis. Results are expressed as mean ± SEM, *P = 0.02 from HC, Student t test, n = 4 in each group. (D,E) Immunofluorescent staining for SERT was performed on sections of normal mouse colon. SERT staining is in green contrasting with blue counterstained nuclei. SERT is principally expressed on the surface area of colon mucosa, but not in the lamina propria. (F,G) Immunofluorescent staining for SERT and E-cadherin was performed on sections of normal mouse colon. SERT staining is in green and E-cadherin in red, contrasting with blue counterstained nuclei. SERT is principally expressed in the mature differentiated epithelial cells where E-cadherin is primarily localized. Immunofluorescent staining for SERT in normal (H) and IBS-D FS injected mouse colon (I). The average fluorescence intensity was lower in mouse colon after IBS-D FS treatment. (J) RT–PCR of TPH1 in distal colon from mice treated with HC or IBS-D FS. Results are expressed as mean ± SEM, *P = 0.29 from HC, Student t test, n = 10 in each group. (K) Western blot of TPH1 in distal colon from mice treated with HC or IBS-D FS, quantified by densitometry analysis. Results are expressed as mean ± SEM, *P = 0.26 from HC, Student t test, n = 4 in each group. (L and M) RT-PCR of Chag and MAOA in distal colon from mice treated with HC or IBS-D FS. Results are expressed as mean ± SEM. *P = 0.11 from HC for Chag, *P > 0.99 from HC for MAOA, Student t test, n = 6 in each group.

