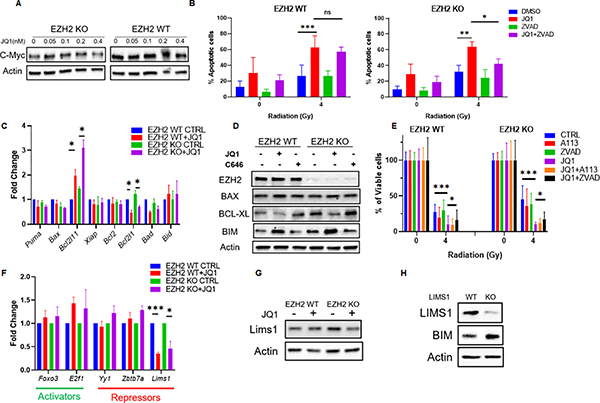
Figure 7. BET inhibition alters the transcriptional profile in favor of pro-apoptotic factors.
A) WB analysis of indicated proteins in EZH2-WT and EZH2-KO #51 medulloblastoma cells that were mock-treated or treated with indicated concentrations of the BET inhibitor JQ1 for 24h. (B) EZH2-WT and EZH2-KO #51 medulloblastoma cells were mock-treated or pre-treated with 0.1μM BET inhibitor JQ1 for 24h and were mock-irradiated or exposed 4Gy IR. Cell population undergoing apoptotic cell death was determined by Annexin V staining followed by flow cytometry analysis 48h after IR. (C) qRT-PCR analysis showing the transcript levels of indicated genes in EZH2-WT and EZH2-KO #51 medulloblastoma cells that mock-treated or treated with 0.1μM BET inhibitor JQ1 for 24h. (D) WB analysis of indicated proteins in EZH2-WT and EZH2-KO #51 medulloblastoma cells that were mock-treated or treated with 10μM CBP/p300 inhibitor C646 or 0.1μM BET inhibitor JQ1 24h. (E) MTT assay showing percentage of viable cells in EZH2-WT and EZH2-KO #51 medulloblastoma cells. Cells were mock-treated or pre-treated with 1μM Bcl-XL inhibitor A1331852, 0.1μM BET inhibitor JQ1, 25 μM pan-caspase inhibitor z-VAD-FMK or indicated combinations thereof for 24h and either mock-irradiated or exposed to 4Gy IR. Percentage of viable cells was determined 7d after IR. Data of three independent experiments are shown as mean +/− SD. Paired one-tailed T-test was used for statistical analysis (***p < 0.001; *p < 0.05). (F) qRT-PCR analysis showing the transcript levels of indicated genes in EZH2-WT and EZH2-KO #51 medulloblastoma cells that mock-treated or treated with 0.1μM BET inhibitor JQ1 for 24h. (G) WB analysis of indicated proteins in EZH2-WT and EZH2-KO #51 medulloblastoma cells that were mock-treated or treated with 0.1μM BET inhibitor JQ1 for 24h. (H) WB analysis of indicated proteins in EZH2-WT #51 medulloblastoma cells 4. (B, C, F) Data of three independent experiments are shown as mean +/− SD. Paired two-tailed T-test was used for statistical analysis (***p < 0.001; **p < 0.01; *p < 0.05).

