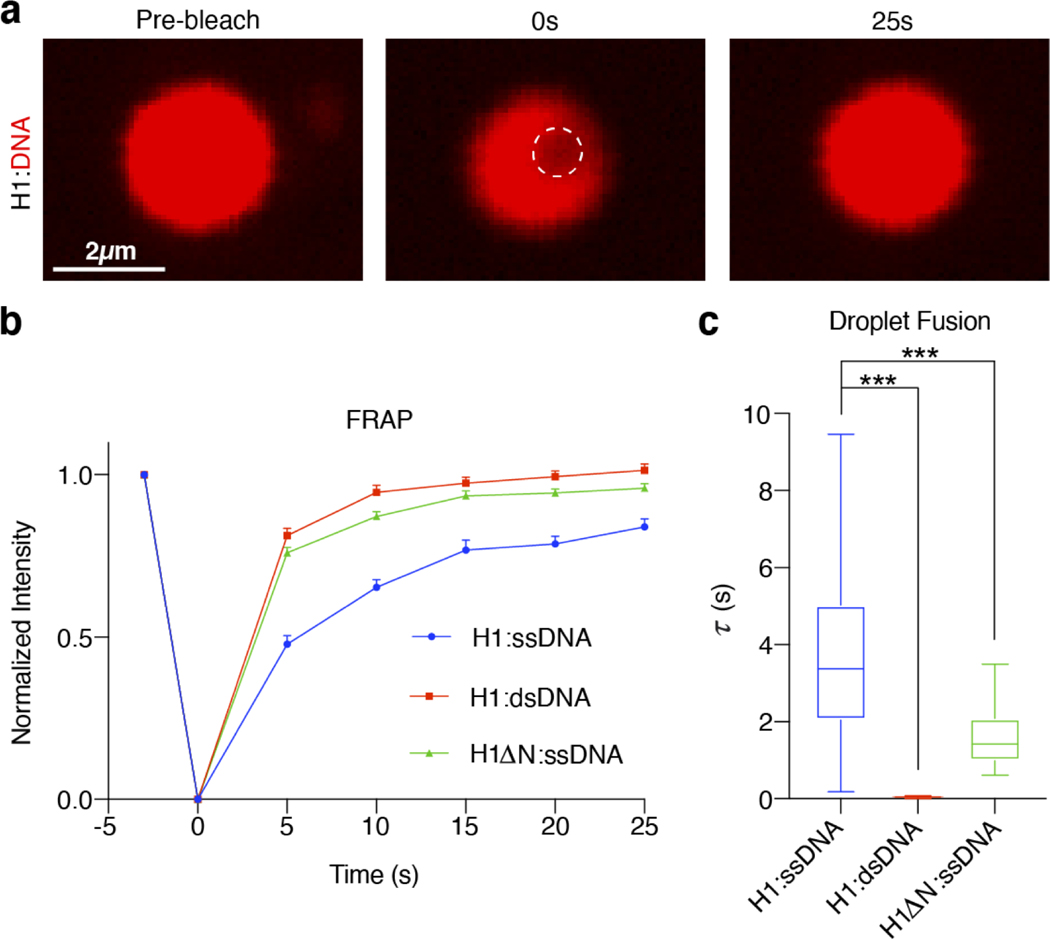
Extended Data Fig. 5. Additional analyses of the biophysical properties of H1:DNA droplets.
a, A representative series of images (among 28 independent experiments) during the photobleaching and fluorescence recovery of an H1:Cy5-ssDNA75 droplet. b, Kinetics of fluorescence recovery for H1:Cy5-ssDNA75 (blue) (n=28), H1:Cy5-dsDNA75 (red) (n=15), and H1AN:ssDNA75 (green) (n=17) droplets. Data are presented as mean values ± SEM. c, Droplet fusion time (τ) for H1:Cy5-ssDNA75 (n=56), H1:Cy5-dsDNA75 (n=24), and H1AN:ssDNA75 (n=15) droplets. The top and bottom edges of each box represent the 3rd and 1st quartiles of the data, and the middle line in each box represents the median value. The top and bottom whiskers represent the maximum and minimum values. Significance calculated using a one-way ANOVA with Dunnett’s test for multiple comparisons (***p<0.001).

