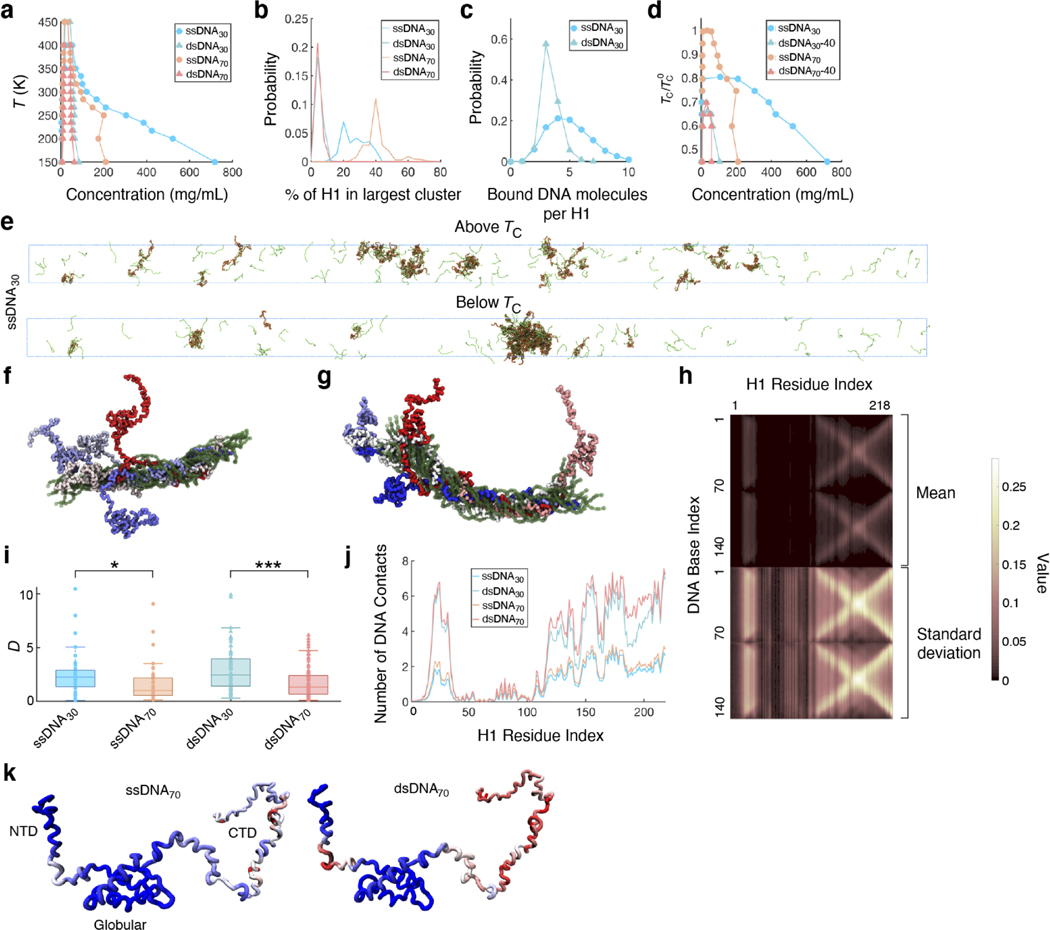
Extended Data Fig. 6. Computational examination of H1:DNA phase separation.
a, Phase behavior of the four simulated systems (H1:ssDNA30, H1:dsDNA30, H1:ssDNA70, H1:dsDNA70) as a function of temperature. b, Probability distribution of the percentage of H1 molecules found in the largest cluster at a temperature of 300 K. c, Probability distribution of the number of DNA molecules bound to each H1 molecule. d, Test of finite size effects on the computational phase diagrams in the temperature-concentration plane. For dsDNA, smaller systems with 40 H1 and 160 DNA molecules were used, but the trends shown in Fig. 3a are conserved. e, Representative configurations for the ssDNA30 system above and below TC. f, A single H1:dsDNA70 pair at different time points in our simulation. g, Different pairs ofH1:dsDNA70 at one time point. h, Contact map of bound H1:DNA pairs. Data include all H1:DNA pairs that have at least one residue in contact. The top half of the matrix represents the mean values of the fraction of time each residue-nucleotide pair is in contact, given that the H1 and DNA molecules are in contact. The bottom half represents the standard deviation of this matrix across time and ensemble. The significantly larger standard deviations relative to the mean values support the conformational heterogeneity of H1:dsDNA complexes. i, Diffusion coefficient (D) of H1 in each system at 300 K. All values were normalized by the median D for ssDNA70. Each data point represents the D value for an individual H1 molecule over the course of our simulation (n=40 for ssDNA, n=80 for dsDNA). Significance determined using a two-sample t-test (*p<0.05, ***p<0.001). The top and bottom edges of each box represent the 3rd and 1st quartiles of the data respectively, and the middle line indicates the median value. Whiskers extend to the minimum and maximum values of the data set that are within 2.7σ, where σ is the standard deviation. j, Average number of DNA residues in contact with any given H1 residue as a function of the H1 residue index. k, Average number of DNA residues in contact with any given H1 residue projected onto a structural model of H1. Data range from most contacts (red) to fewest contacts (blue).

