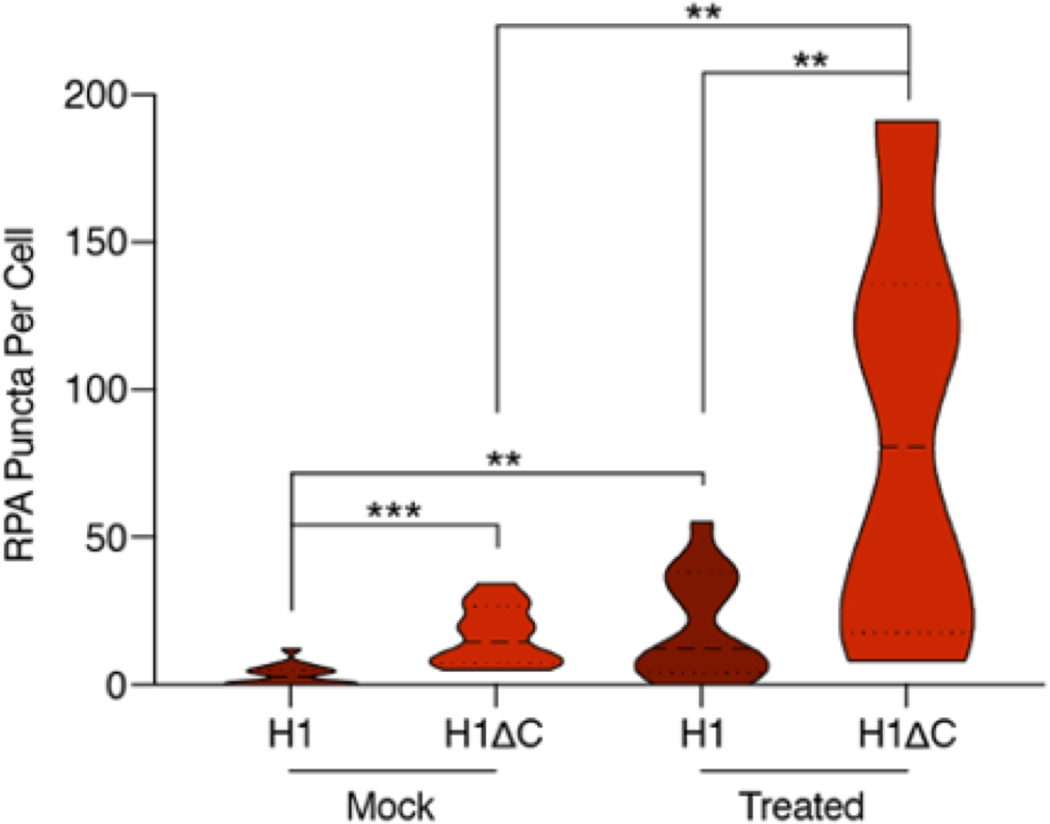
Extended Data Fig. 9. Quantification of RPA puncta in the nucleus.
Violin plot showing the distribution of number of RPA puncta per cell for eGFP-H1 and eGFP-H1ΔC transfected cells after mock or HU + AZD6738 treatment. Significance calculated using Welch’s t-test (**p<0.01, ***p<0.001). eGFP-H1, mock (n=16 independent nuclei), eGFP-H1ΔC, mock (n=12), eGFP-H1, treated (n=15), eGFP-H1ΔC, treated (n=12).

