
FIG. 1.
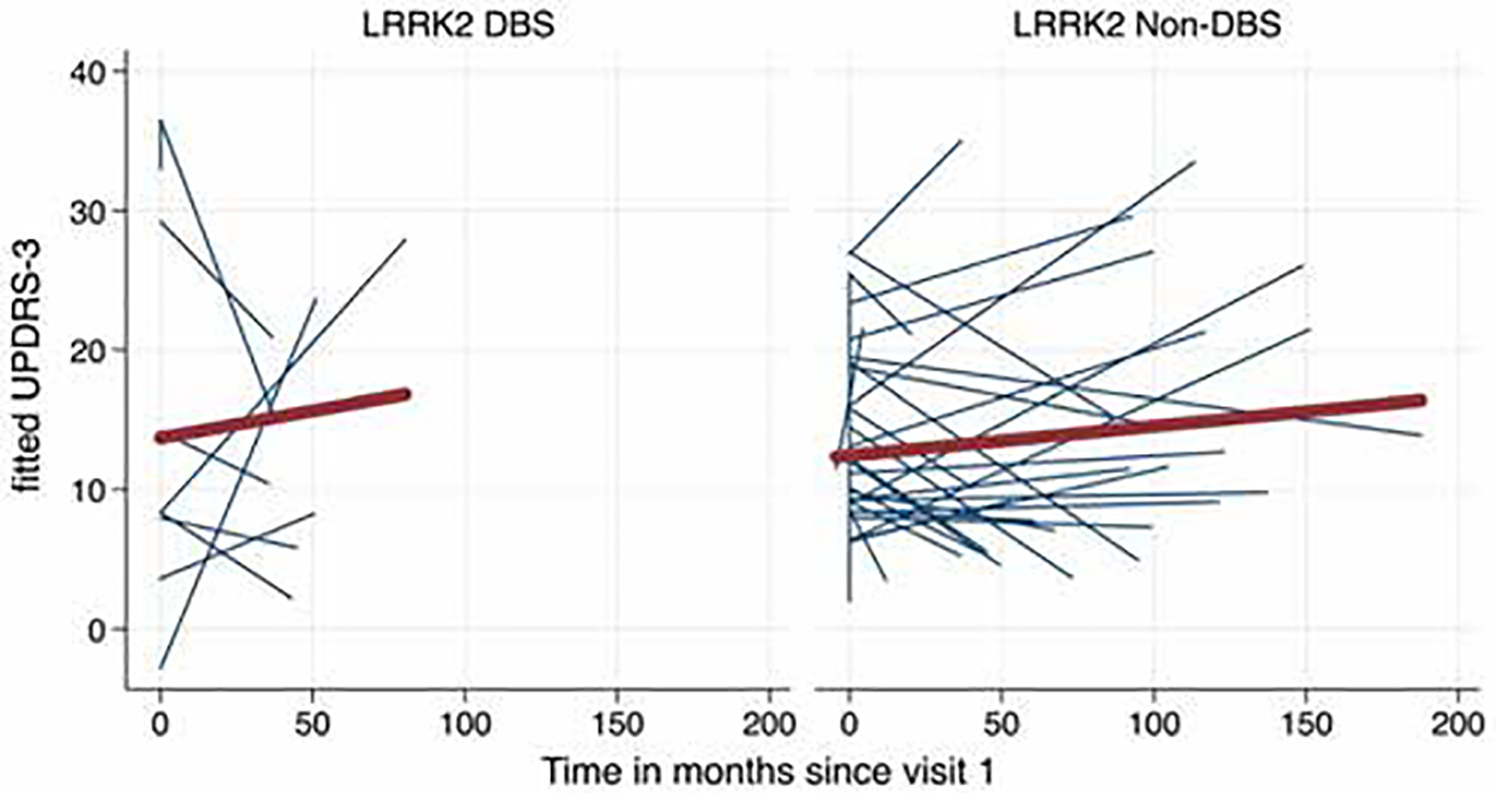
Spaghetti plot of fitted (predicted) motor trajectories (UPDRS-III) of LRRK2-PD subjects. Blue lines represent individual subjects and the red line is average trend of all subjects. Left: Preoperative motor trajectories of LRRK2-DBS subjects. Right: Preoperative motor trajectories of LRRK2 non-DBS subjects.