FIG. 2.
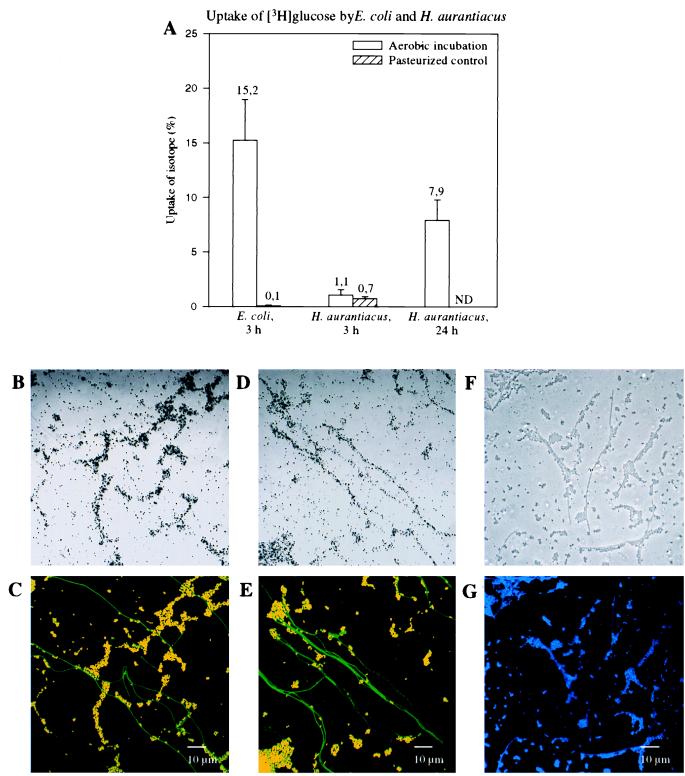
Radiometry and microautoradiography combined with FISH performed with pure cultures of E. coli and H. aurantiacus. (A) Liquid scintillation counts for viable and pasteurized E. coli and H. aurantiacus cells after incubation with [3H]glucose for 3 h. For H. aurantiacus [3H]glucose uptake was also determined after 24 h. ND, not determined. (B through E) Confocal laser scanning microscopic images of artificial mixtures of E. coli and H. aurantiacus incubated with [3H]glucose and analyzed by a combination of microautoradiography and FISH by using Cy3-labeled probe GAM42a (red) and Cy5-labeled probe EUB338 (colored green by image analysis). (B) Microautoradiographic image of E. coli and H. aurantiacus after 3 h of incubation with [3H]glucose. (C) Whole-cell hybridization of the microscopic field in panel B. E. coli cells appear yellow because of the overlapping labels. (D) Microautoradiographic image of E. coli and H. aurantiacus after 3 h (E. coli) and 24 h (H. aurantiacus) of incubation with [3H]glucose. (E) Whole-cell hybridization of the microscopic field in panel D. (F and G) Confocal laser scanning microscopic images of an artificial mixture of pasteurized E. coli and H. aurantiacus cells incubated with [3H]glucose for 3 h and analyzed by a combination of microautoradiography (F) and DAPI staining (G). Since no silver grain formation was observed in the pasteurized control sample, cell morphologies were determined by using the transmission mode of the confocal laser scanning microscope.

