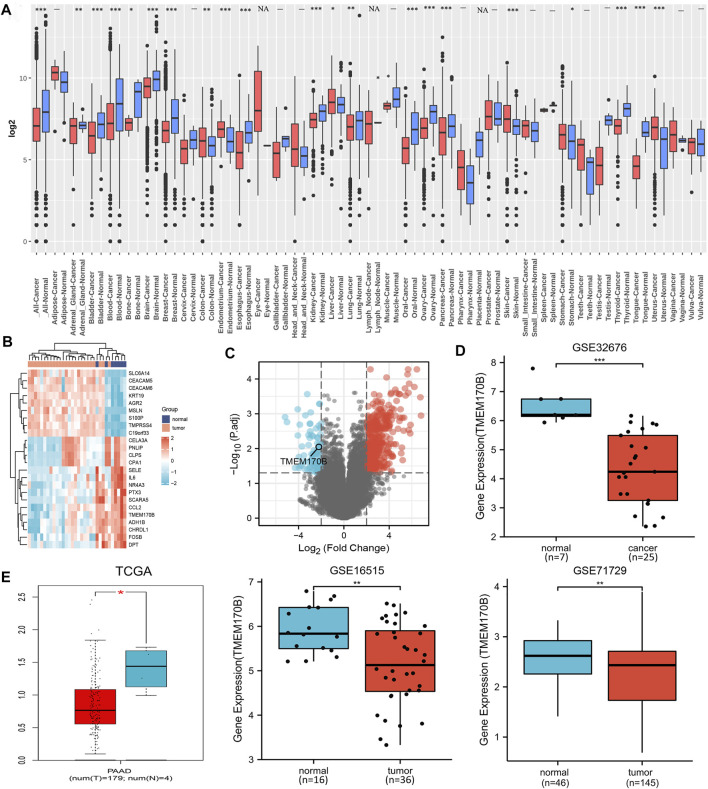
FIGURE 1.
TMEM170B mRNA expression levels in different tumors and corresponding adjacent normal tissues. (A) The pan-cancer TMEM170B expression status was analyzed using GENT2 based on the GEO database. (B) The heat map of the top 24 ranked DEGs. (C) The volcano plot of all DEGs, red represents up-regulated, blue represents down-regulated genes. (D,E) The expressions of TMEM170B in pancreatic adenocarcinoma and the corresponding nontumor tissues were inferred by analyzing the TCGA and GEO databases. ns: not significant. *p < 0.05; **p < 0.01; ***p < 0.001.

