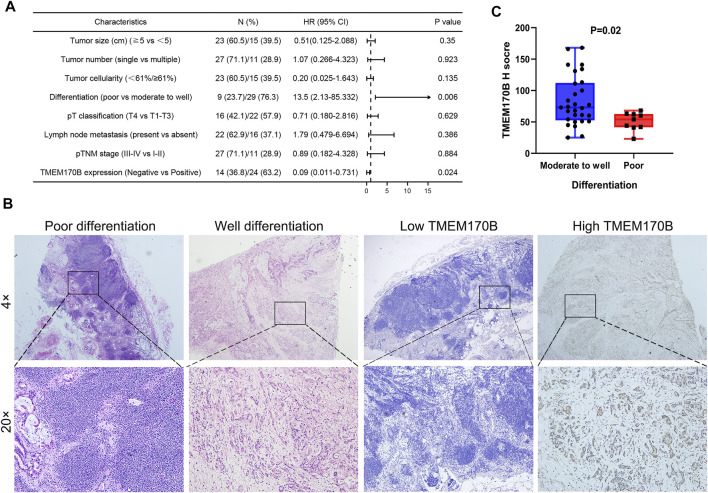
FIGURE 4.
Correlation of TMEM170B expression with the degree of differentiation in PAAD. (A) The Cox regression analysis of the forecast factors of OS by univariate analysis. (B) The histopathological comparison of the degrees of differentiation and TMEM170B expression of the same specimen. (C) TMEM170B Expression in Moderate to well differentiation group and poor group.

